
Projects
Consolidated Dataset and Metrics for High-Dynamic-Range Image Quality
Aliaksei Mikhailiuk, Maria Perez-Ortiz, Dingcheng Yue, Wilson Suen, Rafał K. Mantiuk
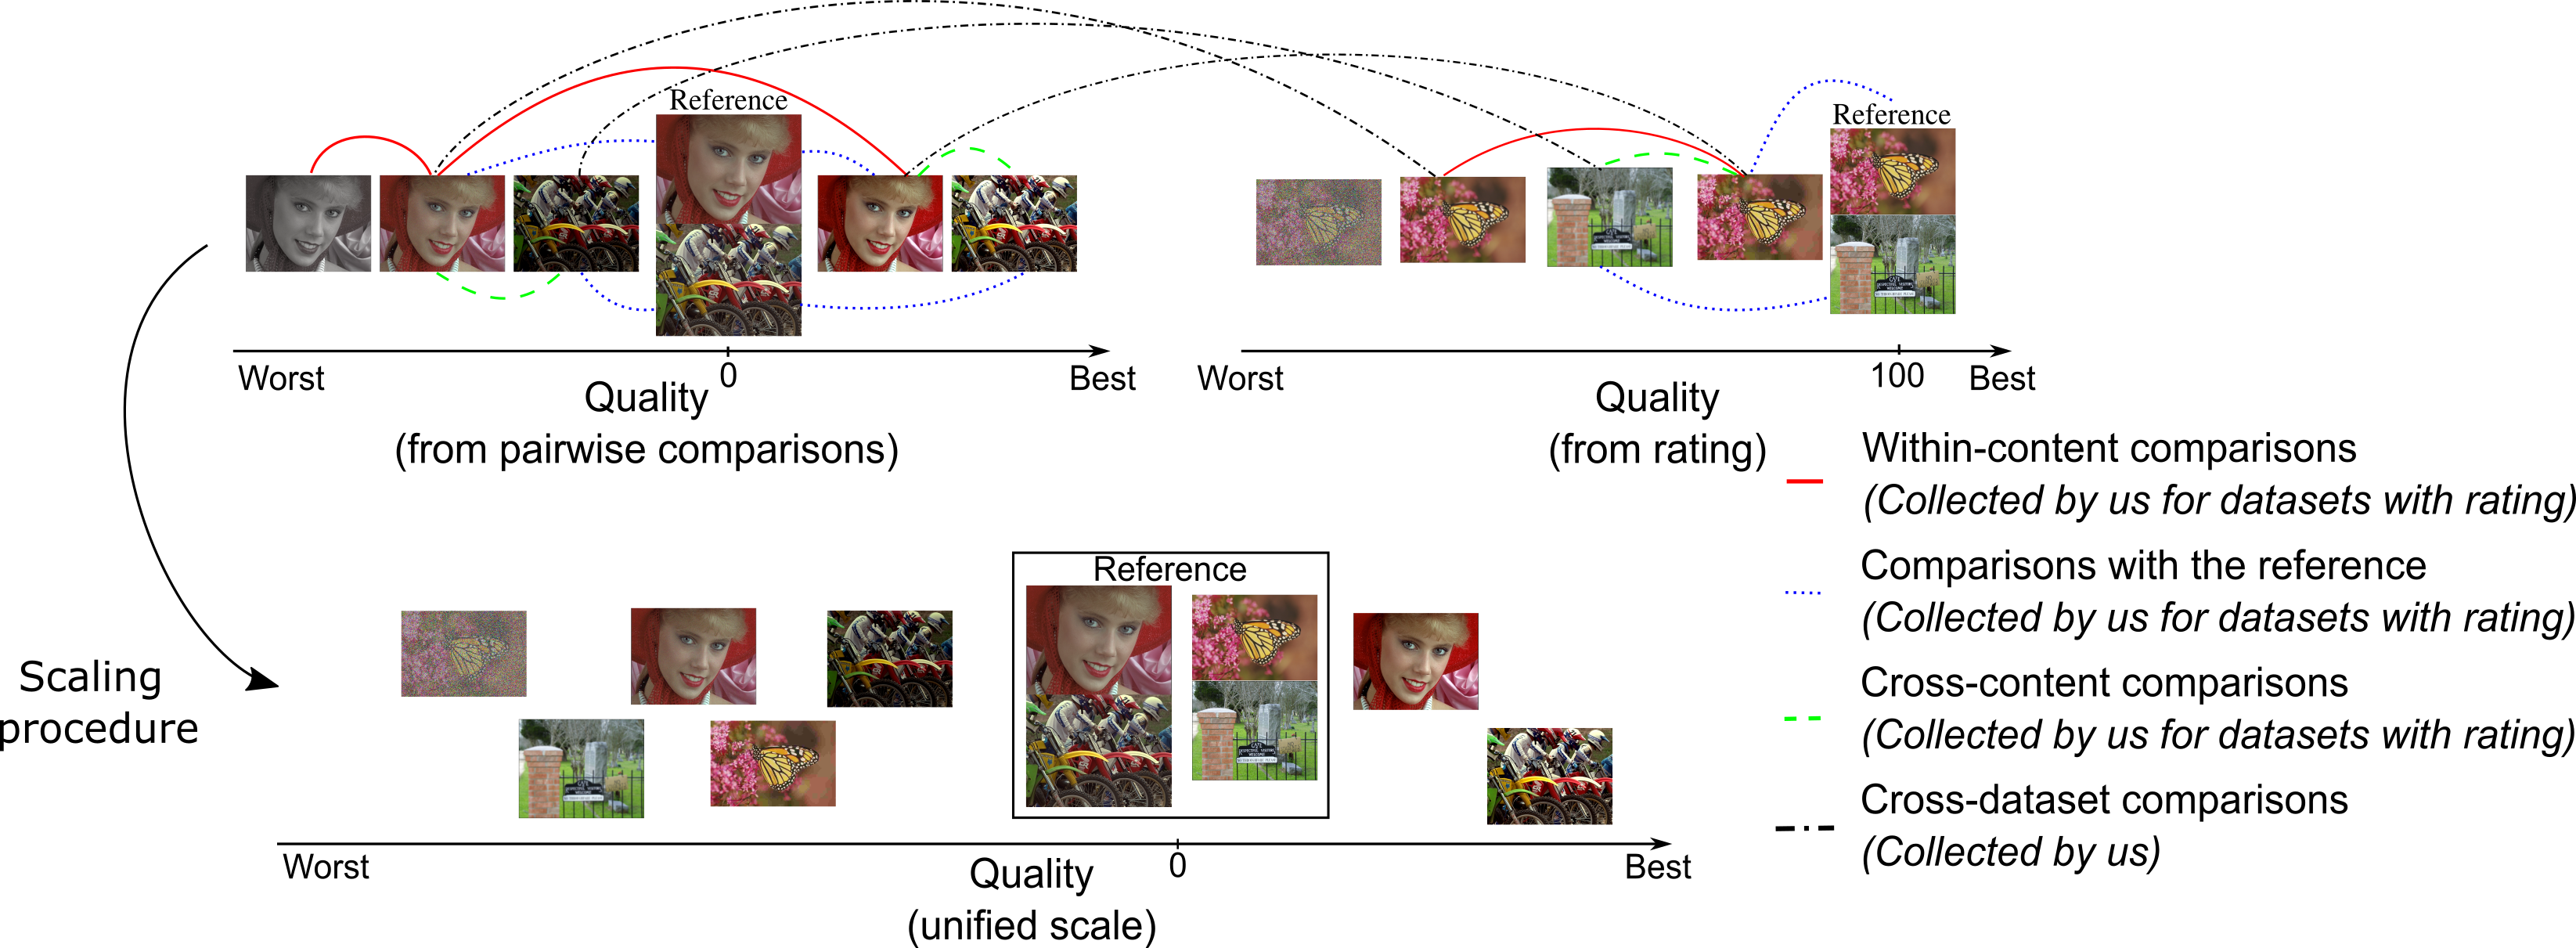
Types of comparisons necessary for dataset alignment. The lines link pairs of images selected for pairwise comparisons. Within-content comparisons (red solid lines) are most commonly used in pairwise comparison experiments. However, such datasets often lack comparisons with reference (blue dotted lines), which are useful to provide an absolute anchor of quality. Cross-content comparisons (green dashed lines) are less common, but can substantially improved the quality of the scale. Finally, cross dataset comparisons (black dash-dotted lines) are necessary to scale the datasets together.
Abstract
Increasing popularity of HDR content brings the need for metrics that could predict the severity of image impairments as seen on displays of different brightness and dynamic range. Such metrics should be trained and validated on a sufficiently large subjective image quality dataset to ensure robust performance. As the existing HDR quality datasets are limited in size, we created a Unified Photometric Image Quality dataset (UPIQ) with over 4,000 images by realigning and merging existing HDR and SDR datasets. The realigned quality scores share the same unified quality scale across all datasets. Such realignment was achieved by collecting additional cross-dataset quality comparisons and re-scaling existing data with a psychometric scaling method. Images in the proposed dataset are represented in absolute photometric and colorimetric units, corresponding to light emitted from a display. We use the new dataset to retrain existing HDR metrics and show that the dataset is sufficiently large for training deep architectures. We show the utility of the dataset in image compression that adapts to screen brightness.
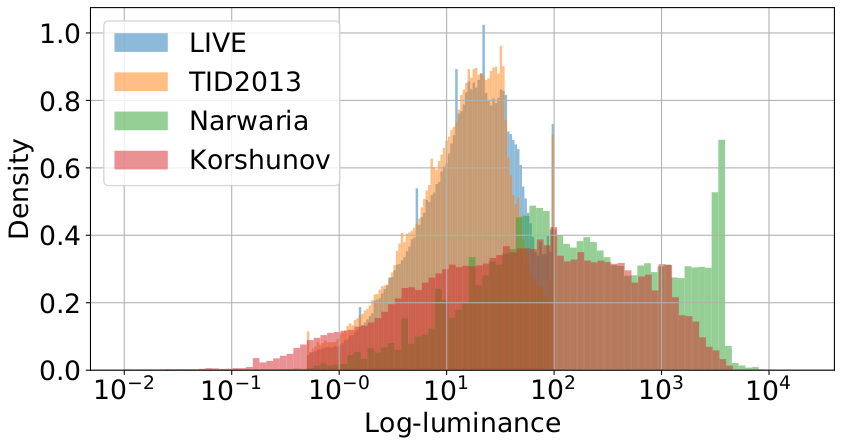
Distribution of log-luminance per dataset (TID2013 (SDR) [1], LIVE (SDR) [2], Narwaria (HDR) [3], and Korshunov (HDR) [4]). All four datasets span very large dynamic range.
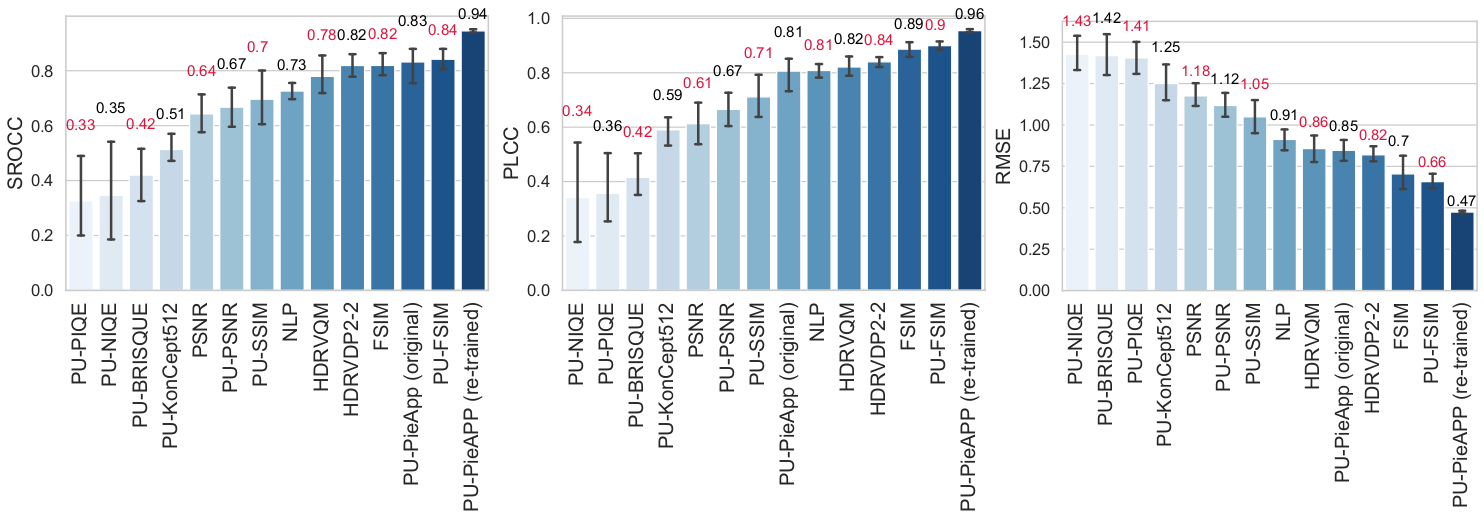
Cross-validation results for all trained metrics, expressed as SROCC, PLCC and RMSE. Error bars denote 95\% confidence intervals.
[1] N. Ponomarenko, L. Jin, O. Ieremeiev, V. Lukin, K. Egiazarian, J. As-tola, and Benoit, “Image database TID2013: Peculiarities, results andperspectives,”Signal Processing: Image Communication, vol. 30, pp.57 – 77, 2015.
[2] H. Sheikh, M. Sabir, and A. Bovik, “A Statistical Evaluation ofRecent Full Reference Image Quality Assessment Algorithms,”IEEETransactions on Image Processing, vol. 15, no. 11, pp. 3440–3451, 2006.
[3] M. Narwaria, M. P. Da Silva, P. Le Callet, and R. Pepion, “Tonemapping-based high-dynamic-range image compression: study of opti-mization criterion and perceptual quality,”Optical Engineering, vol. 52,no. 10, 2013.
[4] P. Korshunov, P. Hanhart, T. Richter, A. Artusi, R. Mantiuk, andT. Ebrahimi, “Subjective quality assessment database of HDR imagescompressed with JPEG XT,” in2015 Seventh International Workshopon Quality of Multimedia Experience (QoMEX), May 2015, pp. 1–6.
Materials
- Paper [Paper]/[Supplementary]
- Dataset [Dataset]
- PU-PieAPP Code [GitHub]
Publication
Aliaksei Mikhailiuk, Maria Perez-Ortiz, Dingcheng Yue, Wilson Suen, Rafal K. Mantiuk. Consolidated Dataset and Metrics for High-Dynamic-Range Image Quality IEEE Transactions on Multimedia, 2021