
Raspberry Pi
Raspberry Pi Logging Program
Written by Matthew Kirk.
In the previous section, we wrote a program to log temperature data. But it was all done from the command line, and our program was designed around that one type of data— we couldn't use it to log anything else.
So to make our temperature logging program into a fully fledged data logger that can deal with any type of measurement, and to make it easier to use, I wrote a graphical interface to the program, that lets you select what kind of data you want to measure using a "plugin" system (see below), and lets you fiddle with the settings of how you record the data.
The GUI that I have created allows us to write small pieces of code that will measure data from a new type of sensor, and easily get the sort of data logger that was created in my other tutorial for a temperature sensor, without having to write anything more.
You can download the program from here. This package also contains the memory sensor and temperature sensor plugins, so you can get straight down to measuring something. To run it, you will need to install the PyQt4 package using sudo apt-get install python-qt4. If you want to be able to live plot the data as you are measuring it, you will need to install gnuplot using sudo apt-get install gnuplot-x11. To use the temperature sensor plugin, you will need to update the kernel, using the instructions in this step and then install the RPi.GPIO Python module, as described in the first two bullet points of this step. To run the program, first extract the files from graphical-logger.tar.gz by right clicking on the file and selecting "Extract here" from the menu, or by using tar -xzf graphical-logger.tar.gz. Then find the file main.py, double-click on it and select "Execute".
Our extra piece of code that "plugs in" to the already written logging code to give it extra abilities is known as a plugin, and this document will lead you through the simple steps to write a plugin.
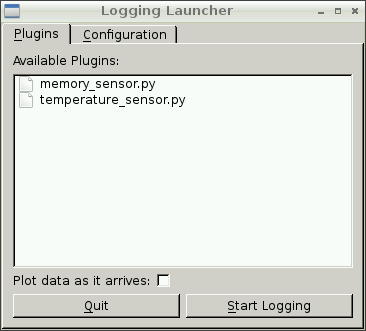
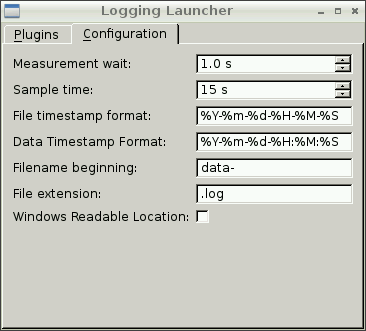
These screenshots show the two tabs of the GUI logging
program, the plugin tab and the configuration tab. The
main tab lists what plugins have been written, and gives
you the option of plotting the data live as it is
collected. The configuration tab lets you change the
settings of how the data is collected, and how it gets
stored.
First Things First
To start with, we'll need to find a sensor we want use, and work out how to get measurements from it in Python. Once you have done this, we can start writing our plugin.
Creating a plugin
To create a plugin, we need to write a Python program, but in a particular way, an example of which is shown below:
class MyNewSensor(Sensor):
return data
What we have here is a Python class. Put simply, a class is a way of representing a "thing" to a computer. In our case, the thing we want to represent is a sensor. This MyNewSensor class is based on the Sensor class, and has a single function called get_data. This function should do whatever it needs to to get data from the new sensor, and then should return the data.
Because we are using the Sensor class that I have written, all the rest of the functions that could be used (see the end of this tutorial) are already taken care of for us. But if we want to make our plugin program use these extra functions, then all we have to do is add our own version to our code, and the logging program will make use of those instead. This is one of the most important features of this "class-y" way of programming.
The naming scheme is important - if your class is called MyNewSensor, it needs to be put in a file called my_new_sensor.py, otherwise it won't work with the logging program.
What more can we do?
What is shown here is the minimum amount of code that we need to write. There are a few other functions that we could write, which are understood by the logging program. These functions are setup, wait_for_start, stop_measuring and finished. Using these extra functions, we can make use of more complicated sensors, that need some setting up before measurement, or have our logging program react to input. In the file _sensor.py, there are more detailed descriptions of what these functions can do, but here is an overview:
- setup - Any bits that need to be done before taking measurements, such as setting up variables or turning on something.
- wait_for_start - If your circuit has some way of indicating that logging should start, like a button, this function is where you should wait for it.
- stop_measuring - If you have another button or something to indicate that you want to stop measuring, this is where you should check this. If you want this function to be used, you will also have to set can_quit to True in your class.
- finished - Shutdown or stop anything that needs to stopped once logging stops, such as turning off an LED.
If you read the temperature_sensor.py file, you will see how each of these functions are used to make that plugin behave exactly as the temperature logger program that was developed in the other tutorial. If you haven't worked through that tutorial, and so don't know how that temperature plugin should work, don't worry. Included in the program download along with the temperature sensor plugin is a memory sensor plugin (which uses all the available functions), and a complete guide to writing this plugin is in the next section.
Plugin Tutorial
This is a tutorial on how to write your own plugin script, but with a slight twist. Instead of making use of a hardware sensor, we are going to get our data from the Pi itself - this means you can do this yourself without having to get hold of any bits and pieces, and there's a much lower risk of burning your finger on anything.
What we are going to measure is how much memory is available on the Pi - that is, how much free RAM we have, in megabytes. Our plugin will also record the percentage of free RAM. We are going to use all five functions available to us, to make our plugin start and stop is slightly interesting ways. As we are measuring memory let's call our class MemorySensor, and so save it to a file called memory_sensor.py.
-
Let's start with setup. In our plugin, we will write the word "started" to a file in the current directory.
def setup(self):
filename = "logging" with open(filename, "w") as f:f.write("started")The with statement here you may or may not have seen before - it is a Python-y way of opening files to avoid having to remember to close them later. The code above is completely equivalent to:
def setup(self):self.filename = "logging"
f = open(self.filename, "w")
f.write("started")
f.close()However, the version using with is generally considered better.
-
Next, we are going to write the wait_for_start function. In our plugin, the wait for start will be a simple delay, rather than being a wait for input.
def wait_for_start(self):time.sleep(5)The function sleep is in the time module, as you can see, so in order to use this, we will also have to add the line import time to the begining of the text file.
-
Now, for the most important function - the get_data function. Our data comes from the file /proc/meminfo, which contains lots of information about the RAM. Try doing cat /proc/info to see what format the information comes in. You'll see something like this:
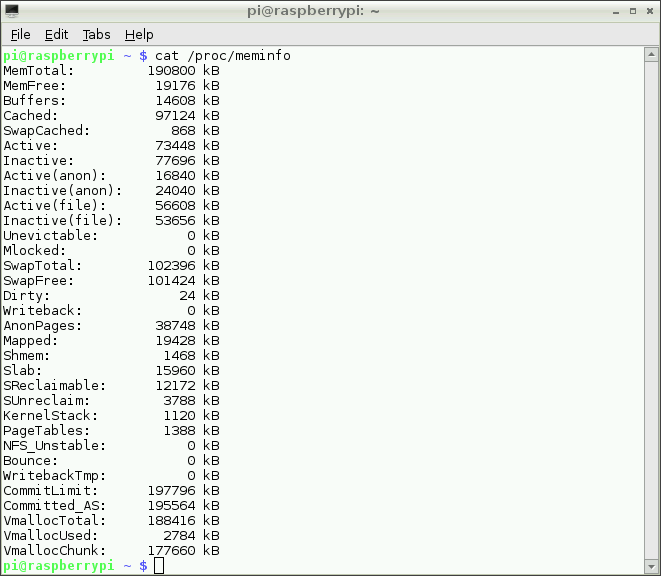
As you can see, the information in the file has the format of a description, folllowed by a colon, then some blank space, then a number, and a unit.
So to get out the amount of free RAM, we will need to read this file, select the second line, separate out the number, and then divide by 1000 to get the value in MB. To get the percentage free, we also need the value from the first line, the total memory, and we'll need to divide the free memory by the total and multiply by 100.
def get_data(self):with open("/proc/meminfo") as f:line1 = f.readline()total_mem_KiB = float(line1.split()[1])
line2 = f.readline()
free_mem_KiB = float(line2.split()[1])
free_mem_kB = free_mem_kiB * 1.024
free_mem_MB = free_mem_kB / 1000
percent_free = (free_mem_kiB / total_mem_kiB) * 100
return (free_mem_MB, percent_free)In this code, we are opening the file /proc/meminfo and reading the first two lines. Then we take the strings we get, and split them up using the whitespace, and select the middle section, and turn that piece of text into a float.
Then we do something that is (possibly) slightly unexpected. We take our number, and multiply by 1.024 and then divide by 1000. As you might guess from the variable names, this is because, despite what the file says, the numbers is gives us are in kibibytes (KiB), not kilobytes (kB). The reason behind this is slightly complicated, but unless you really care, it's not worth worrying about.[1] All I'm doing is just changing the units.
Finally, we also calculate the percentage of free memory, and return a tuple contain both pieces of data. Because we are returning two bits of data, we also need to change the value of the variable no_of_measurements to 2. Because we know we will always want to return two different pieces of data, we can change this variable at the begining of the program. But if we weere unsure about how many pieces of data we would be returning, we could set this variable in the setup function, as is done in the temperature plugin.
-
Remember the file we created in setup? Well, how about we make it so that deleting the file will stop the logging?
def stop_measuring(self):file_exists = os.path.isfile(self.filename)
return not file_existsThe function isfile, which is in the module os.path (so we need to do import os.path), returns True or False depending on whether or not a file exists at the name the we give it. So if it returns True, the file does still exist, and so we return not True which is False.
There is one last thing we need to do to make this work. If you read the _sensor.py file, you'll see that if we want to allow stopping half way through, we need to set the value of the variable can_quit to True. This is because the code in logger.py checks this variable and doesn't use the stop_measuring function.[2]
-
The last function we are going to write is the finished function. To finish off, we will get rid of the file that we created at the begining in setup.
def finished(self):if os.path.isfile(self.filename):os.remove(self.filename)
Now we've written all our code, this is what the full program looks like:
import os.path
from plugins._sensor import Sensor
class MemorySensor(Sensor):
def setup(self):
with open(self.filename, "w") as f:
def wait_for_start(self):
def get_data(self):
line2 = f.readline()
free_mem_KiB = float(line2.split()[1])
free_mem_kB = free_mem_KiB * 1.024
free_mem_MB = free_mem_kB / 1000
percent_free = (free_mem_KiB / total_mem_KiB) * 100
return (free_mem_MB, percent_free)
def stop_measuring(self):
return not file_exists
def finished(self):
- ^ A simple-ish explanation is that, in the early days of computing, file sizes weren't very large, and the difference between 1024 and 1000 didn't really matter, and so they started using the k prefix to mean 1024, rather than the 1000 that it is normally used for. However, as things got bigger, and computers because more widely used, the difference became more significant and the people using computers were less aware of these technical details. So eventually it was decided to invent a new type of prefix to mean multiples of 1024, and so we get KiB (kibibytes), MiB (mibibytes), etc. If you want even more explanation than that, see the Wikipedia page
- ^ If you read this file, you'll see a whole load of code encased by an if plugin.can_quit: test, along with a bit of an explantion of why we are testing it.

Raspberry Pi Logging Program Tutorial by Matthew Kirk is licensed under a Creative Commons Attribution-ShareAlike 3.0 Unported License.