
Research Skills - Graphing exercise
Exercise 4: Graphing
There are two sections to this exercise. The first requires you to correct three graphs. The second requires you to graph two data sets.
Section I - correcting graphs [9 marks]
Each of the graphs in this section has one or more problems that prevents it from being a good graph. For each of the graphs in this section you are required to submit two things:
- An explanation, in a single paragraph, of all the problems with the graph as presented.
- A good graph of the same data.
Graph 1
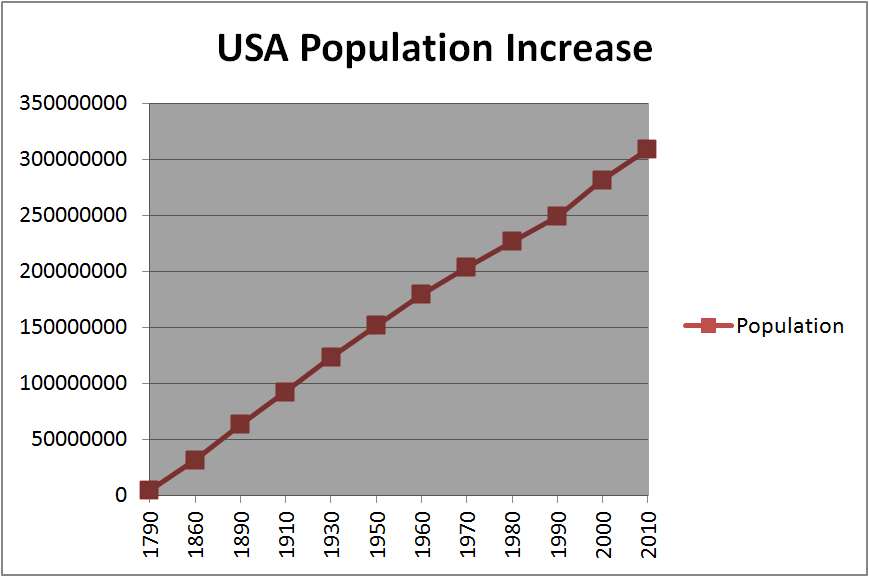
Source: data from US census.
| Year | Population |
|---|---|
| 1790 | 3929214 |
| 1860 | 31443321 |
| 1890 | 62979766 |
| 1910 | 92228496 |
| 1930 | 123202624 |
| 1950 | 151325798 |
| 1960 | 179323175 |
| 1970 | 203211926 |
| 1980 | 226545805 |
| 1990 | 248709873 |
| 2000 | 281421906 |
| 2010 | 308745538 |
Graph 2
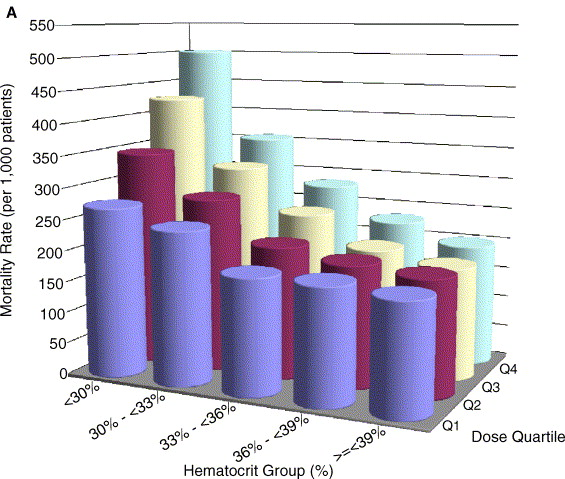
Source: "Hematocrit was not validated as a surrogate end point for survival among epoetin-treated hemodialysis patients", Dennis J. Cotter, Kevin Stefanik, Yi Zhang, Mae Thamer, Daniel Scharfstein, James Kaufman, Journal of Clinical Epidemiology 57(10):1086-1095, October 2004.
| Below 30% | 30-33% | 33-36% | 36-39% | Above 39% | |
|---|---|---|---|---|---|
| Q1 | 271 | 245 | 185 | 184 | 177 |
| Q2 | 344 | 278 | 212 | 195 | 186 |
| Q3 | 425 | 316 | 247 | 199 | 180 |
| Q4 | 501 | 354 | 280 | 227 | 196 |
The table shows the unadjusted one-year mortality rate by hematocrit group (Below 30%, 30-33%, 33-36%, 36-39%, Above 39%) disaggregated by epoetin dose quartile (Q1, Q2, Q3, Q4).
Graph 3
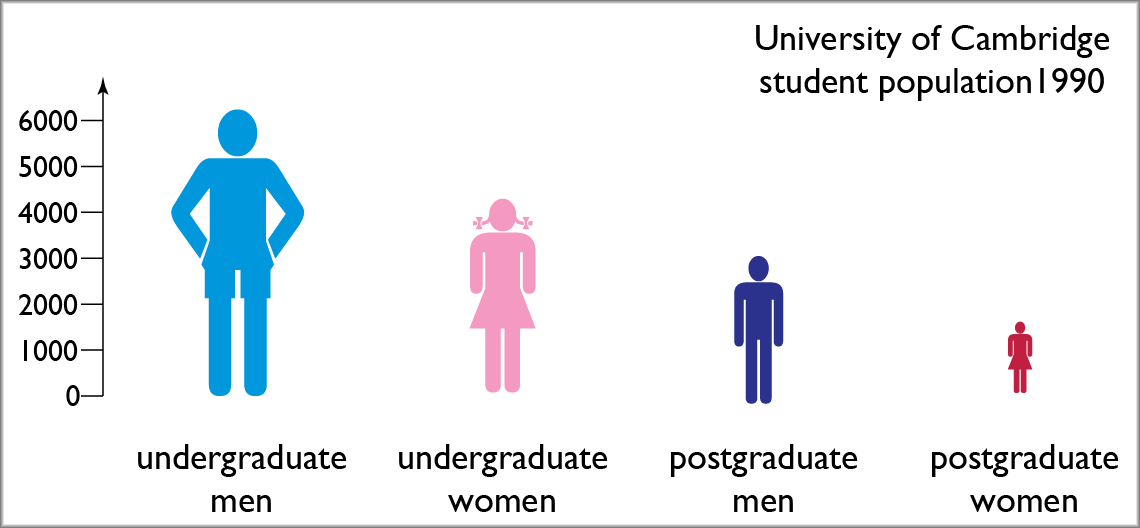
Source: data from Cambridge University Reporter, Special Issue No. 4, 8/10/2009.
Academic year 1990-91
| undergraduate men | 6110 |
| undergraduate women | 4217 |
| postgraduate men | 2516 |
| postgraduate women | 1240 |
Section II - graphing data sets [6 marks]
For each of these sets of data, you are required to investigate the data, then produce a graph that best presents the "story" that you want to tell from the data. More detailed instructions are provided for each data set.
Data Set 4
This data set contains the number of male and female undergraduate and postgraduate students for the academical years 1968-69 through to 2008-09 (source: Cambridge University Reporter, Special Issue No. 4, 8/10/2009). There are five columns of data: the year, UG men (number of undergraduate male students), UG women (number of undergraduate female students), PG men (number of postgraduate male students), and PG woman (number of postgraduate female students).
There are a range of "stories" that you could tell using this data. First, investigate the data. Then choose a particular "story" that you want to tell. Finally, produce a graph that best presents that story. On the graph, write the one sentence that tells me what the "story" is supposed to be.
The data set can be downloaded as a CSV file.
Data Set 5
An inventor has designed a novel web-page graphical object specification. He wants to test the time taken to upload and render these objects in his new web browser. He prepares eighty different objects, twenty of size 2kB, twenty of size 4kB, twenty of size 8kB and twenty of size 16kB. He records the time taken between requesting each object and the completion of the rendering of the object. The times are given below in milliseconds.
Your job is to investigate the data and work out what "story" the data tells. Then produce a graph that presents the data as well as possible. On the graph or chart, write the one sentence that tells me what the "story" is supposed to be.
The data set can be downloaded as a CSV file or below.
| 2kB | 4kB | 8kB | 16kB |
|---|---|---|---|
| 1729 | 2293 | 3276 | 1845 |
| 2642 | 2022 | 2939 | 2201 |
| 1499 | 1486 | 3348 | 3845 |
| 2397 | 2528 | 1918 | 3251 |
| 2065 | 3525 | 2575 | 5282 |
| 2172 | 2271 | 1299 | 4681 |
| 2057 | 1287 | 3773 | 3193 |
| 1486 | 2804 | 3444 | 1923 |
| 1703 | 1608 | 2273 | 2962 |
| 2377 | 2434 | 1592 | 3179 |
| 2552 | 2427 | 2323 | 1592 |
| 1968 | 2632 | 2461 | 2007 |
| 1598 | 2316 | 1256 | 2163 |
| 2025 | 2831 | 1862 | 2745 |
| 2615 | 2633 | 3051 | 4359 |
| 1620 | 1951 | 3853 | 3747 |
| 2205 | 3227 | 3748 | 4435 |
| 2298 | 2019 | 3090 | 3813 |
| 2483 | 2482 | 3345 | 1182 |
| 2072 | 2420 | 4499 | 1319 |
Source: this data set is simulated.