| Computer Laboratory ECAD and Architecture Practical Classes |
This tutorial gives a brief introduction to SignalTap using the first lab as the basis for this. For a more in-depth coverage of this topic, refer to the SignalTap documentation. SignalTap allows you to capture and display real-time signal behaviour on an FPGA design. It is not a simulator, the waveforms shown are the actual ones on the device. SignalTap logs the values of the signals required in the on-chip memory blocks before uploading them back to the PC for analysis. Starting SignalTap IIFirstly, open up the pong.qpf project you created in lab 1. This tutorial uses the final version, however the same techniques can be applied to any project, and so you may find SignalTap useful to debug problems you may have earlier on in the lab. Once you have this open, start up SignalTap by selecting Tools | SignalTap II Logic Analyser. This should bring up the screen shown below. Note that all the images here can be clicked on to bring up a full-resolution version of them.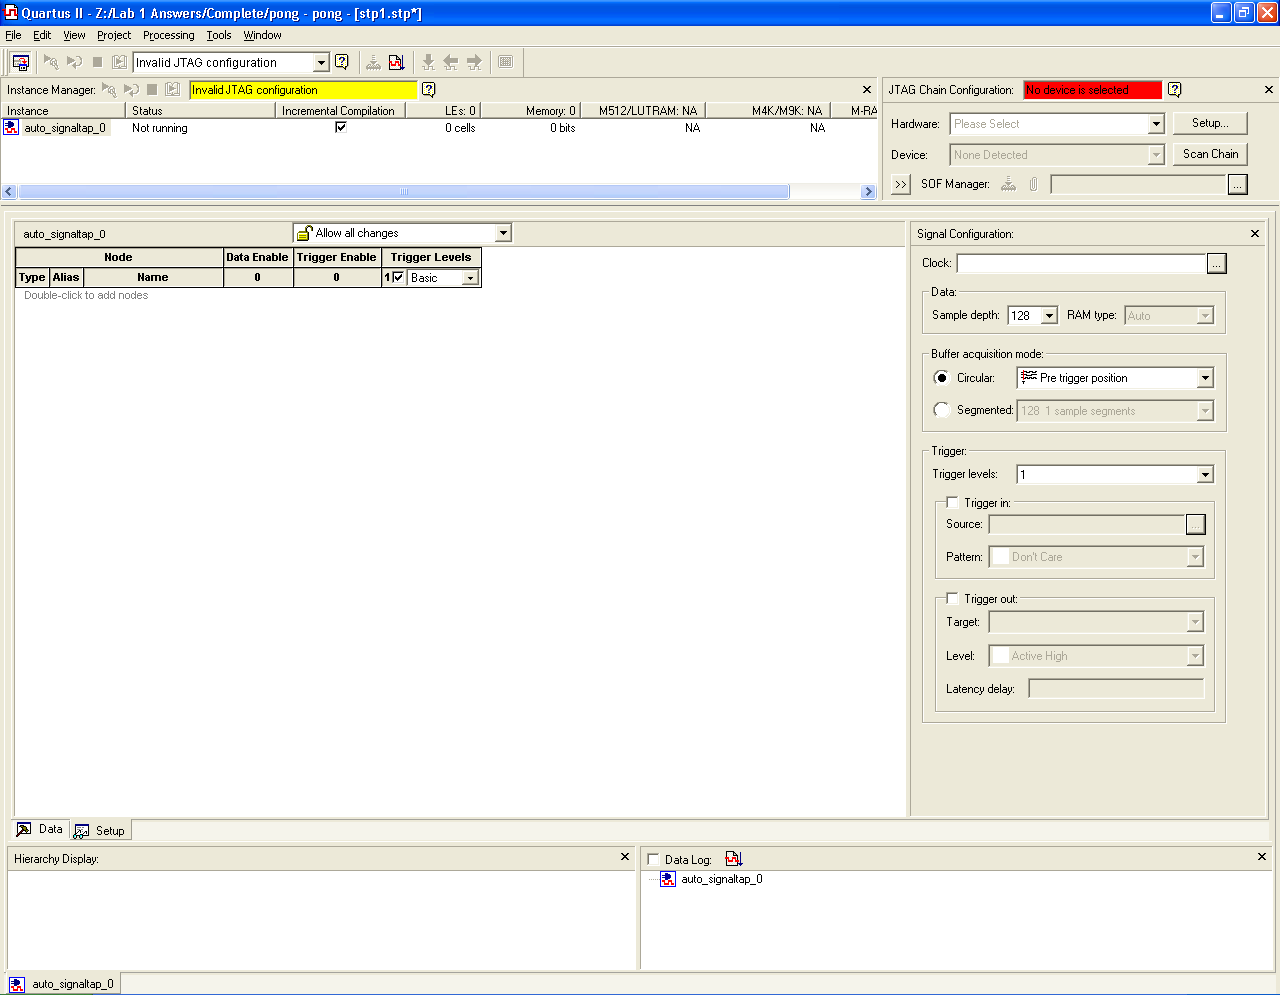
Configuring the instanceThe first thing to do is associate a device with the SignalTap instance. Ensure the DE2 board is attached to the computer and turned on, then just under the red box at the top right, click Setup.... Double click on the USB-Blaster device in the list, and click close. The red box should now no longer be red, and should read JTAG ready. The next step is to associate a clock with the instance. This clock determines when samples will be taken and saved on the chip. For the purpose of this tutorial, we shall use the params module to see the VGA synchronisation signals produced, thus, we need to select this clock for the SignalTap instance.On the right hand side, in the box marked Signal Configuration, click on the button marked ... next to the clock text-box. Click on List to list all the available signals in the project, and add pll108MHz:pll|altpll:altpll_component|_clk0 to the list on the right hand side. This is the output from the pll MegaFunction, which is used as the clock to drive the params module. Click OK to return to the main screen. Finally, set the sample depth to 16K. This determines the number of samples that will be taken by the module. Beware, this is limited by the number of memory bits available, and so if you wish to view a large number of signals you will not be able to have a very large sample depth. The total number of memory bits needed by SignalTap is shown at the top. The screen should now look like this: 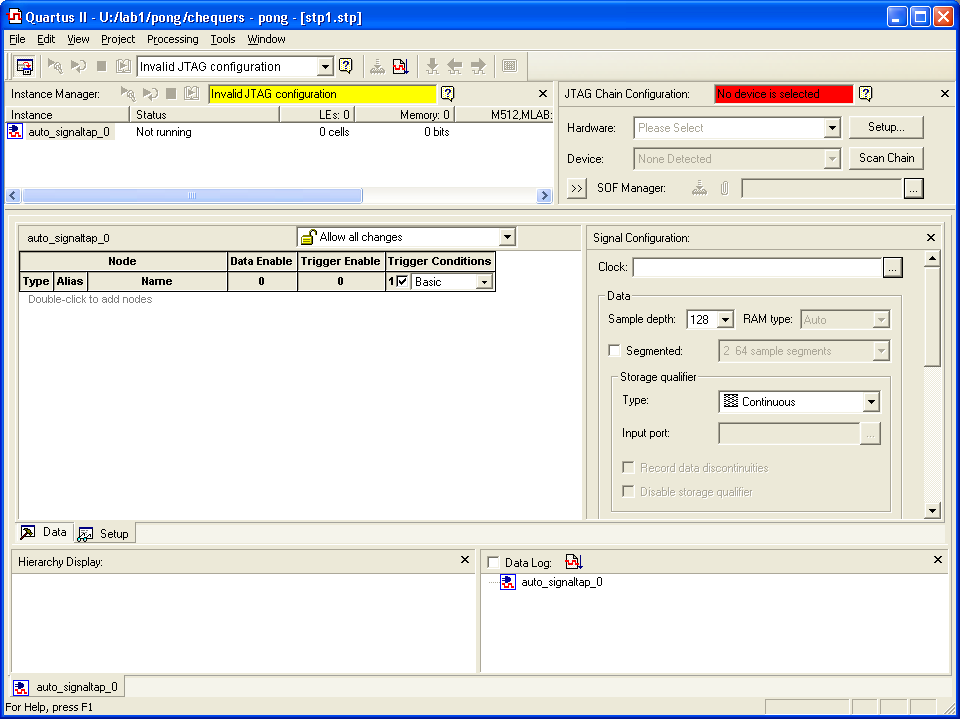
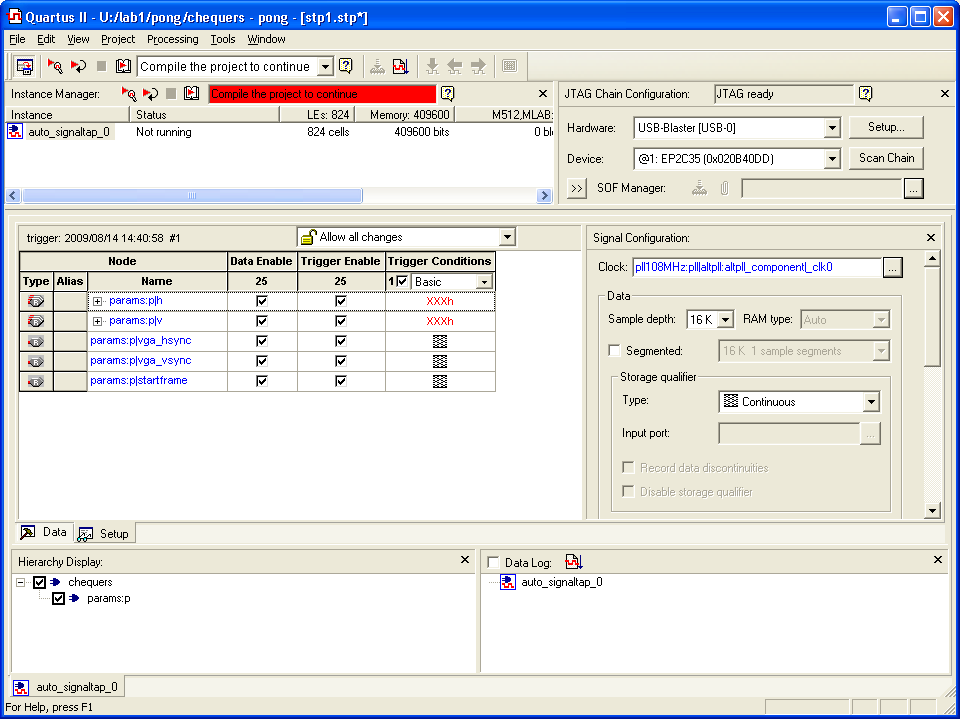
Adding the required signalsYou now need to add the list of signals that you would like to view. For the purpose of this tutorial, select all the signals in the params module. Add these to the SignalTap instance by double-clicking in the main white area of the screen to bring up a dialog box much like the one used to select the clock. Click List to list all the signals in the project. Next, add the following nodes to the list on the right hand side:
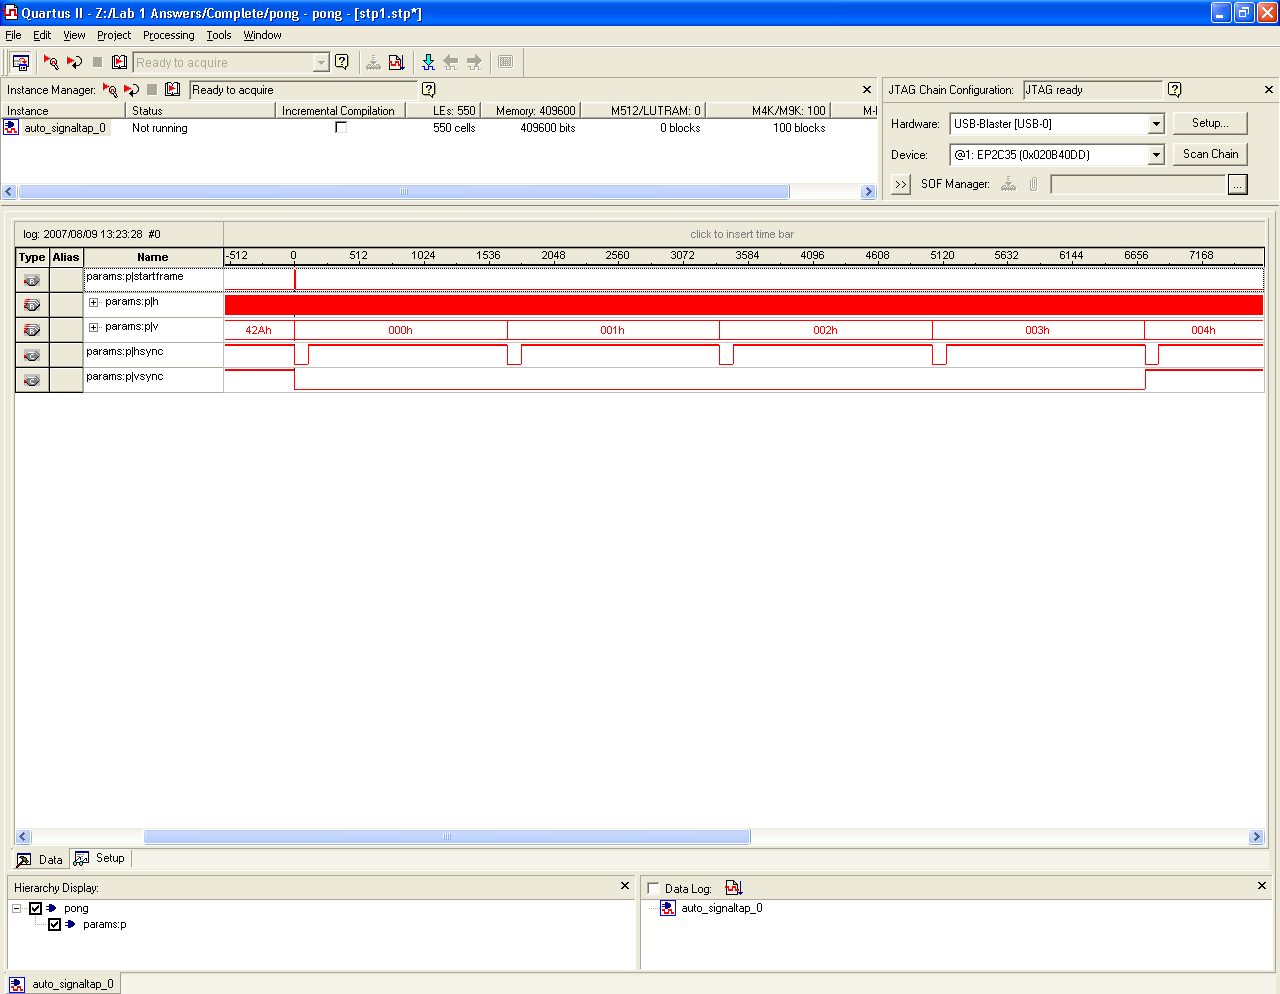
Viewing the signalsBefore you are able to view the signals, you first need to re-compile the project. You will be prompted to save the SignalTap file, and also asked if you wish to enable the file for the current project; click Yes. Once compiled, upload this onto the FPGA as normal. If you get message regarding incremental compilation in the SignalTap file, first click Cancel to abort the compilation, then at the top in the window labelled Instance Manager, uncheck the box under "incremental compilation" and re-compile the project. Once it has compiled, program the device as usual. To collect the data, go back into the SignalTap window, and on the toolbar, click the button with caption Run Analysis. The icon looks like this . You will then be presented with a graph of all the waveforms, hopefully looking like the image below.
Note this has been zoomed out, and so you cannot see the values for h. If you zoom in, you can see h changing as it scans from pixel
to pixel. The hsync signal can clearly be seen, and matches with the diagram shown on the
VGA page. . You will then be presented with a graph of all the waveforms, hopefully looking like the image below.
Note this has been zoomed out, and so you cannot see the values for h. If you zoom in, you can see h changing as it scans from pixel
to pixel. The hsync signal can clearly be seen, and matches with the diagram shown on the
VGA page.
|