L1 < SS < SN < R1 on a controlled toy
15 Nov 2026 · Fei · 3DGS, 3 seeds per number · sRGB PSNR and CVVDP
L1 < SS < SN < R1
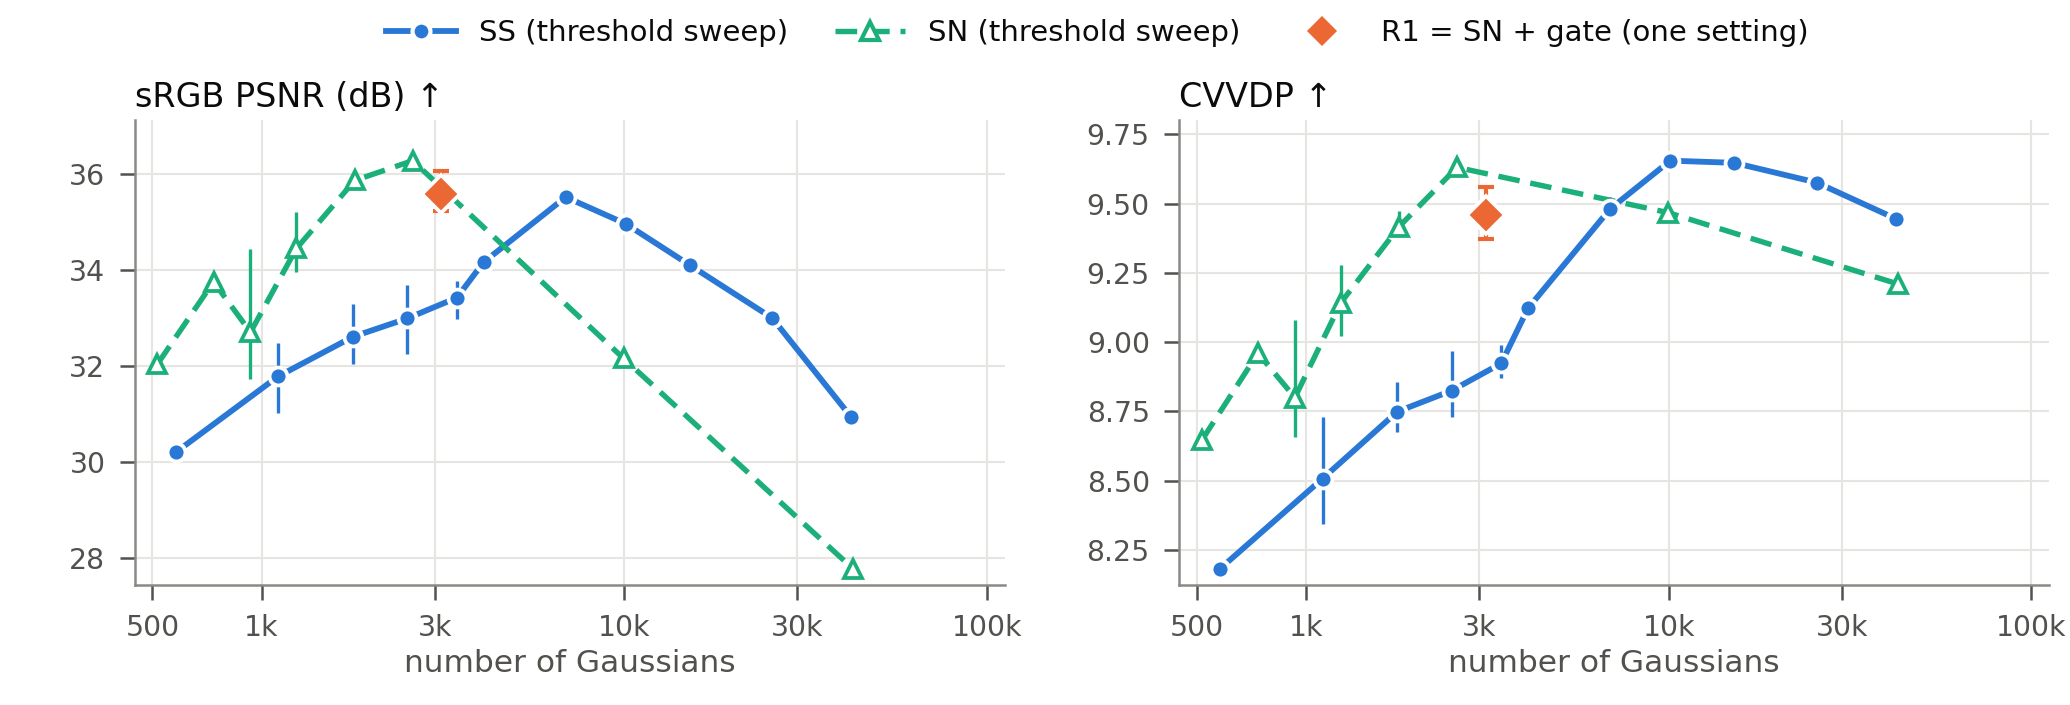
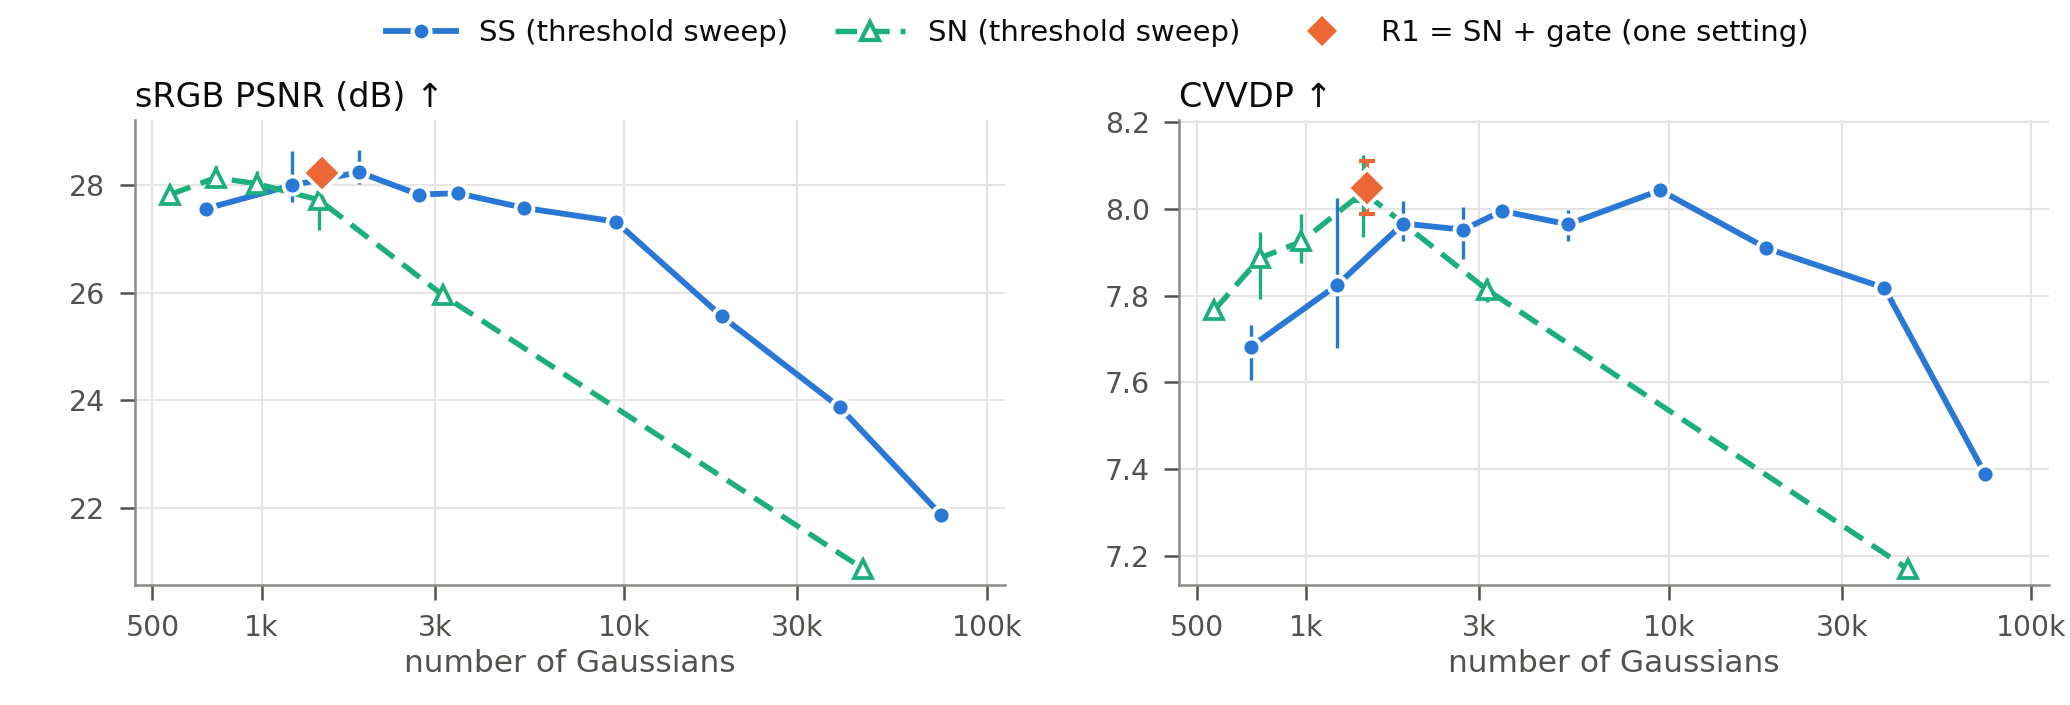
At their best thresholds, L1 < SS < SN. With each baseline's threshold tuned separately at every exposure using ground truth, at t = 4: 33.8 < 35.5 < 36.3 dB. SN needs 2.6k Gaussians; SS needs 6.9k (Fig. 2, Table 1).
R1 stops SN from densifying noise, and it needs no threshold. When the signal gets weak, SN spends more and more Gaussians on noise: with its best t = 4 threshold it grows to 12.8k Gaussians and 16.9 dB at t = 1/4, while R1 drops to 0.6k (Table 3). And since the best threshold moves with the noise level, tuning a baseline on any one exposure and reusing it on all five costs 1.5–4.9 dB somewhere. R1 stays within 0.7 dB of the best tuned baseline at every exposure (0.28 dB on average, also in CVVDP), whichever exposure the baselines are tuned on (Tables 4–5).
Where the gains come from is shown in Table 2.
- L1
- L1 loss; densify on the L1 gradient with a threshold τ.
- SS
- VSF loss (variance-stabilised L1); densify on the VSF gradient with τ.
- SN
- VSF loss; densify on a noise-normalised (relative) score with τ.
- R1
- SN with τ replaced by a noise-calibrated test: a Gaussian splits only when its gradient is significantly larger than noise alone would produce. One setting everywhere.
The toy
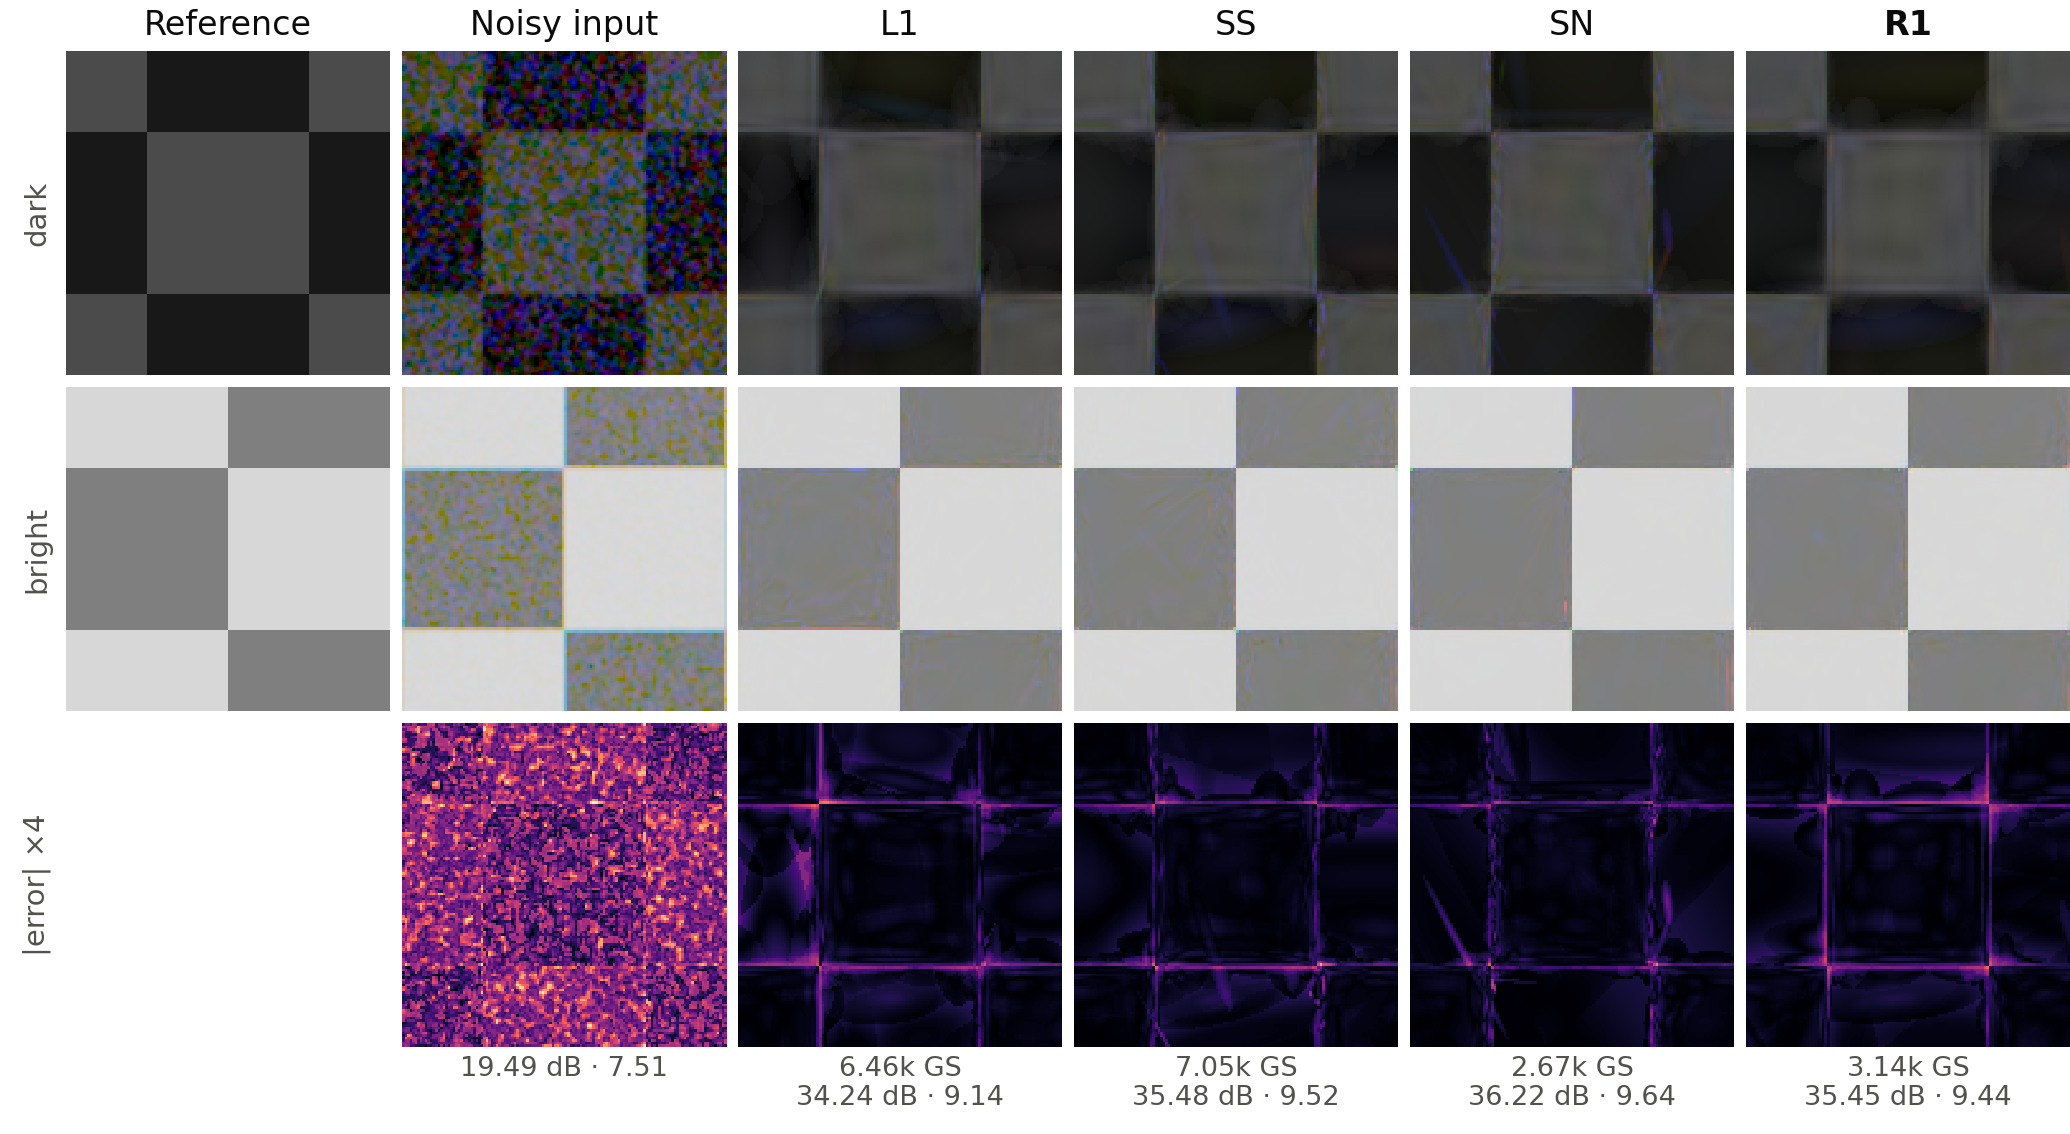
A checkerboard with a dark and a bright half, 16 noisy views, and the Dark3R camera noise model. We vary the exposure t and divide every frame by t, so only the balance between shot and read noise and the SNR change.
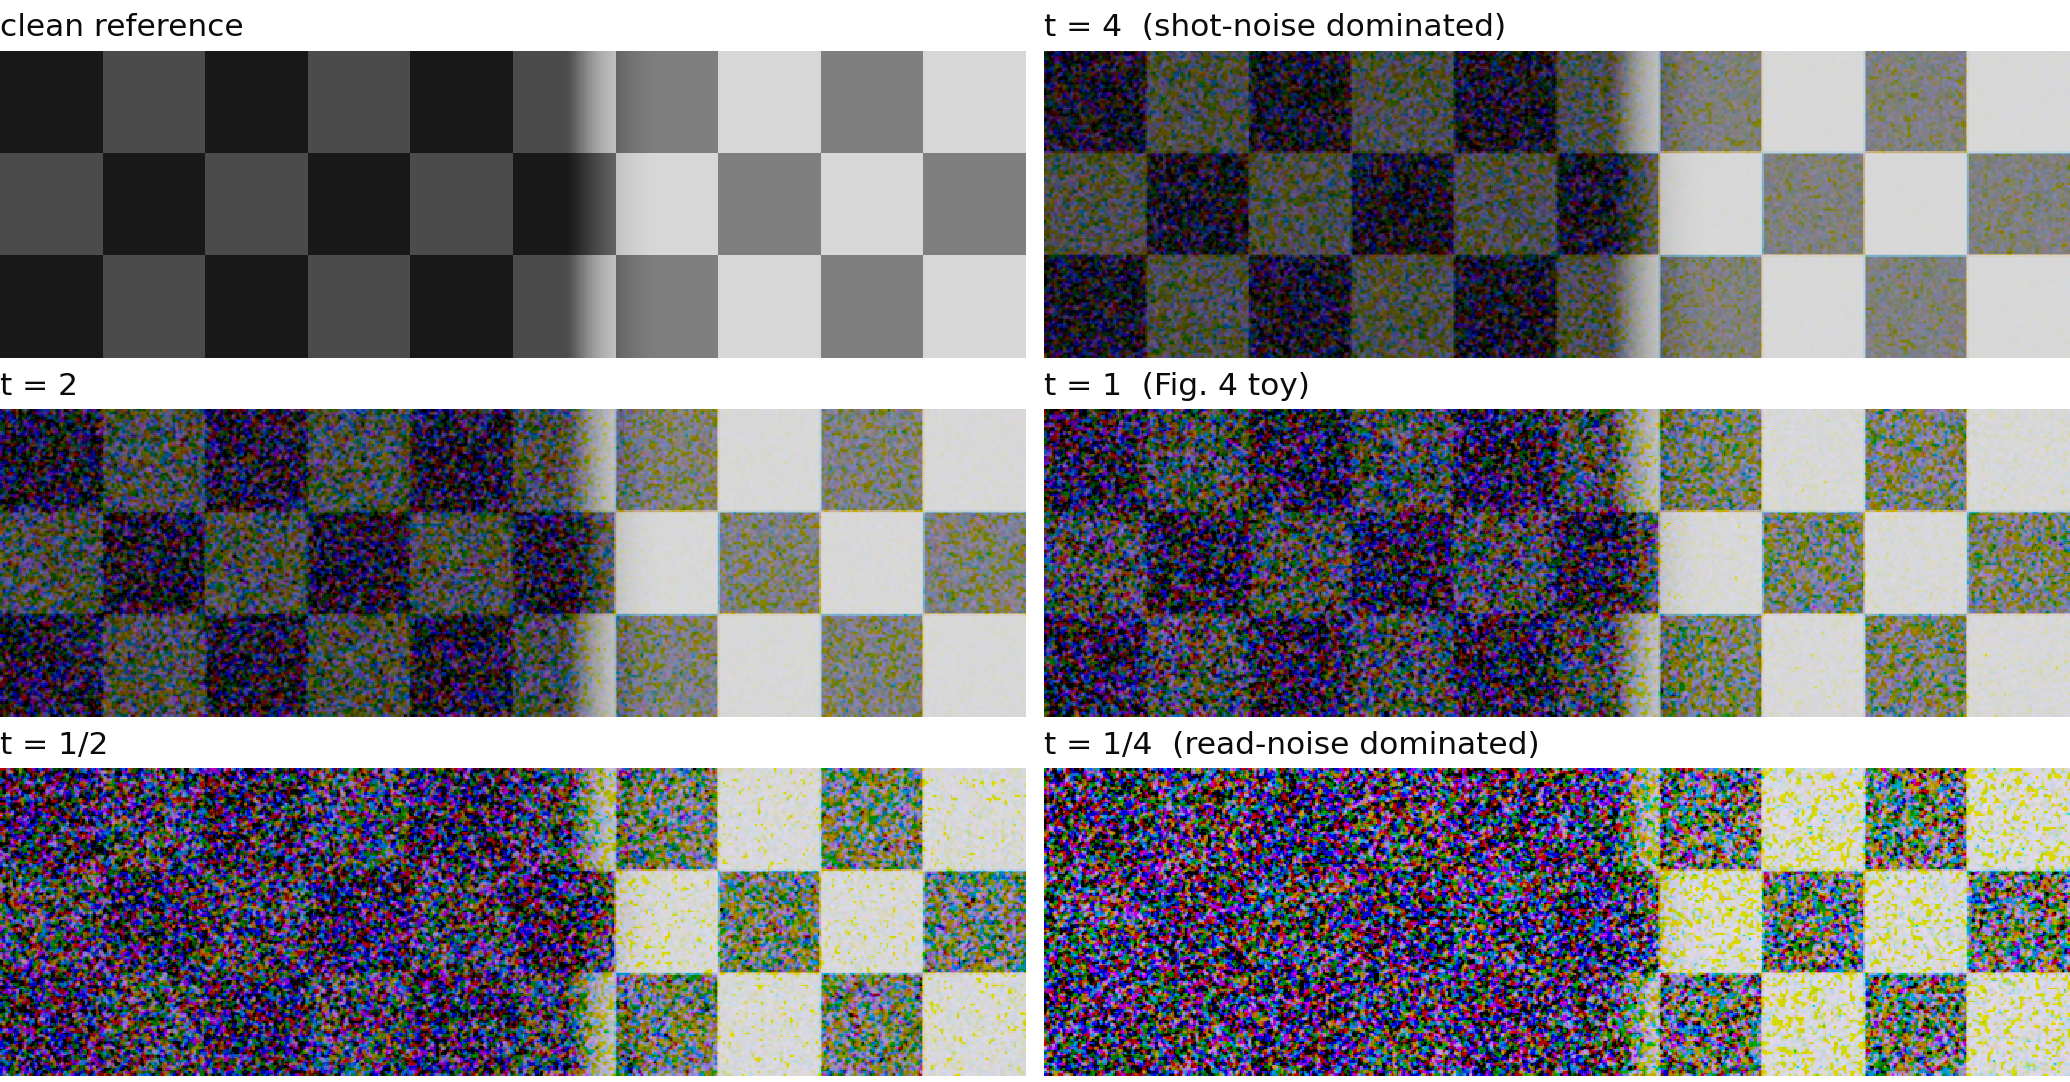
1. At their best thresholds: L1 < SS < SN
Here L1, SS and SN each get their best threshold at every exposure, picked with ground truth: the most favourable case for the baselines. R1 keeps its single setting.
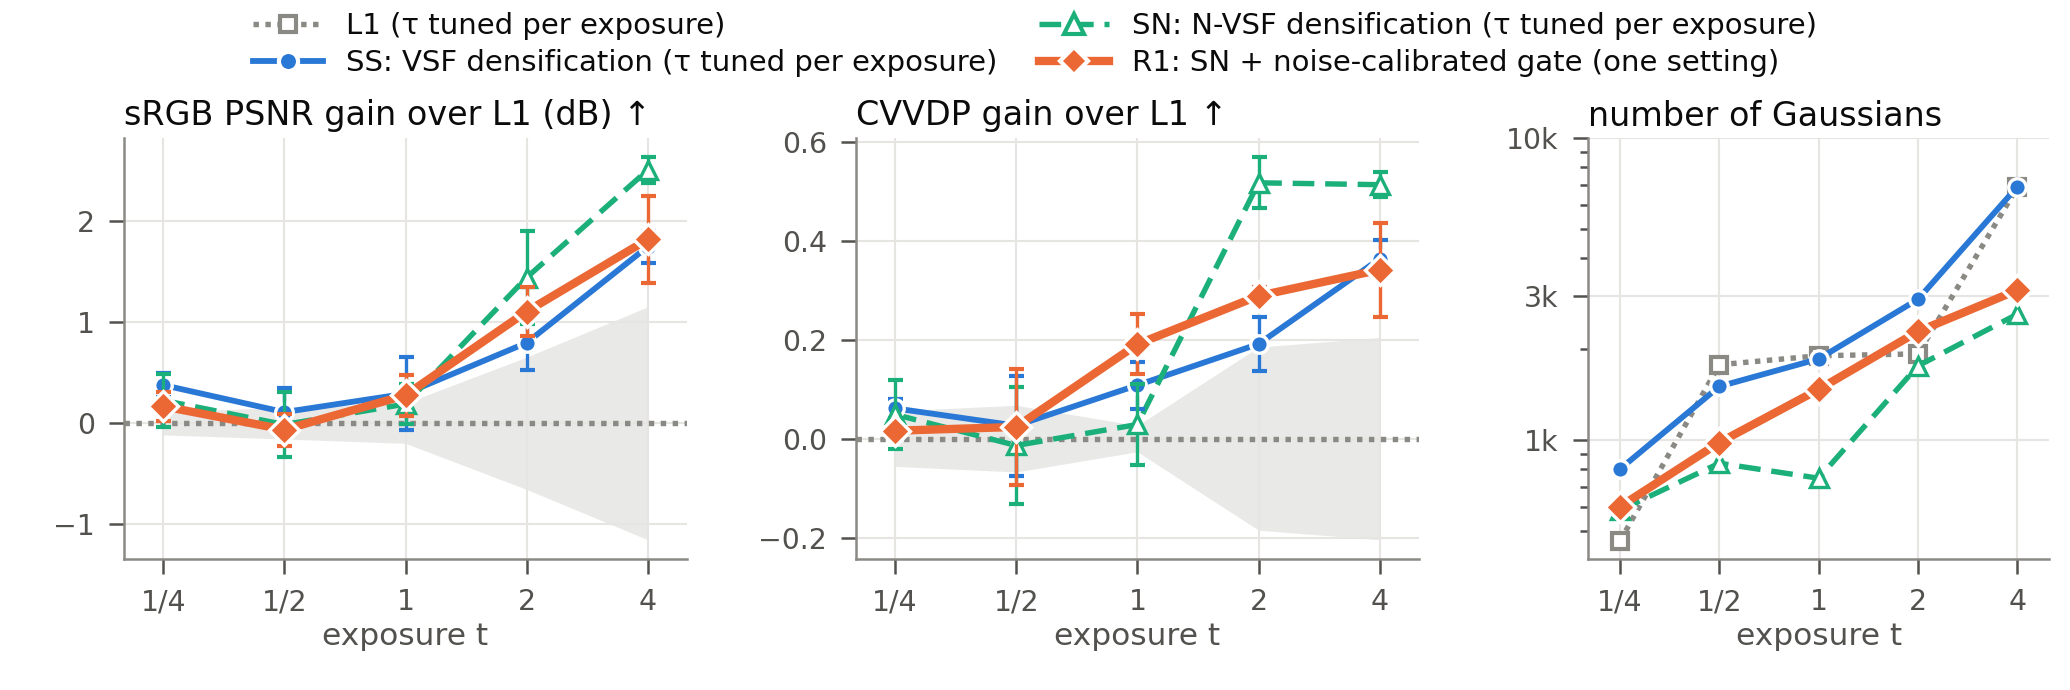
Table 1. Best threshold per exposure (sRGB PSNR; CVVDP · #Gaussians · setting)
| t = 4 | t = 2 | t = 1 | t = 1/2 | t = 1/4 | |
|---|---|---|---|---|---|
| L1 | 33.76 CVVDP 9.12 · 6.9k · τ 1.25e-5 | 30.99 CVVDP 8.57 · 1.9k · τ 5e-5 | 27.95 CVVDP 7.86 · 1.9k · τ 5e-5 | 24.22 CVVDP 6.69 · 1.8k · τ 5e-5 | 21.39 CVVDP 5.68 · 0.5k · τ 2e-4 |
| SS | 35.51 CVVDP 9.48 · 6.9k · τ 0.01 | 31.79 CVVDP 8.77 · 2.9k · τ 0.02 | 28.24 CVVDP 7.97 · 1.9k · τ 0.03 | 24.33 CVVDP 6.71 · 1.5k · τ 0.03 | 21.77 CVVDP 5.74 · 0.8k · τ 0.05 |
| SN | 36.27 CVVDP 9.63 · 2.6k · τ 0.0025 | 32.43 CVVDP 9.09 · 1.8k · τ 0.0035 | 28.14 CVVDP 7.89 · 0.7k · τ 0.007 | 24.21 CVVDP 6.67 · 0.8k · τ 0.005 | 21.62 CVVDP 5.73 · 0.6k · τ 0.007 |
| R1 | 35.58 CVVDP 9.46 · 3.1k · one setting | 32.10 CVVDP 8.86 · 2.3k · one setting | 28.23 CVVDP 8.05 · 1.5k · one setting | 24.15 CVVDP 6.71 · 1.0k · one setting | 21.56 CVVDP 5.70 · 0.6k · one setting |
Bold is the best at each exposure. L1 < SS < SN holds where the noise is signal-dependent (t ≥ 2); at t ≤ 1 the tuned baselines are within 0.4 dB of each other. With its single setting, R1 is 0.3–0.7 dB below the tuned SN at t ≥ 2 and within 0.2 dB of the best baseline at t ≤ 1.
Table 2. Where the gains come from: t = 4, settings with a similar number of Gaussians (PSNR per region)
| t = 4 | sRGB PSNR | dark edges | dark flat | bright | CVVDP | #Gaussians |
|---|---|---|---|---|---|---|
| L1 (τ 5e-5) | 31.84 | 26.47 | 30.85 | 42.19 | 8.59 | 2.2k |
| SS (τ 0.03) | 32.99 | 26.42 | 33.56 | 41.04 | 8.83 | 2.5k |
| SN (τ 0.0025) | 36.27 | 29.54 | 38.03 | 41.49 | 9.63 | 2.6k |
| R1 (one setting) | 35.58 | 29.27 | 36.42 | 41.88 | 9.46 | 3.1k |
L1 → SS. The VSF loss weights pixels by their noise level, so dark regions are no longer drowned out by the noisier bright ones. At a similar budget, dark flat regions gain +2.7 dB. The gain needs signal-dependent noise: it grows with exposure (Fig. 2).
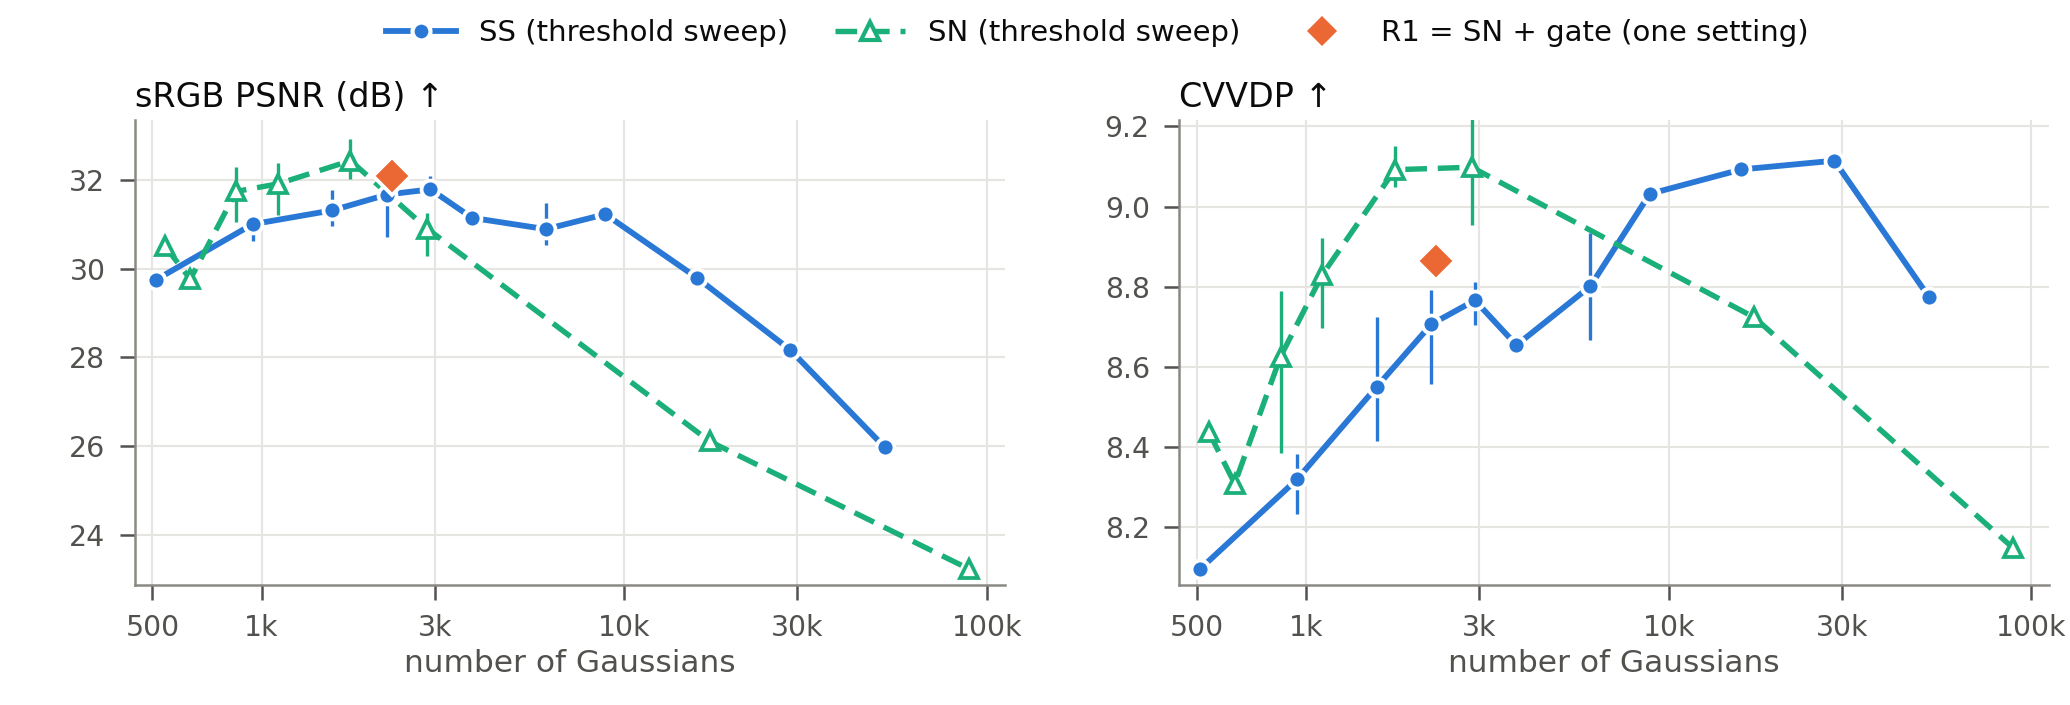
SS → SN. SS ranks where to add Gaussians by absolute error, which favours bright areas. SN normalises the score, so at the same number of Gaussians it puts them into the dark detail: dark edges +3.1 dB and dark flat +4.5 dB, with the bright half unchanged (+0.4 dB). SS reaches that dark quality only by lowering its threshold everywhere: its best setting needs 6.9k Gaussians (2.6× SN's best), and the extra Gaussians over-split the bright half (bright 41.0 → 38.3 dB). The full sweeps are in Figs. 3–5.
2. SN → R1: stop densifying noise, with no threshold to tune
Stop densifying noise (the original motivation). SN's normalised score also boosts weak, noisy pixels. When the signal is weak it keeps splitting on noise; on real scenes an uncapped SN reached millions of Gaussians. On the toy, SN with the threshold that is best at t = 4 grows from 2.6k to 12.8k Gaussians as the exposure drops, and its PSNR falls to 16.9 dB. R1 splits only where the gradient is significantly above the noise, so its count goes the other way, from 3.1k at t = 4 down to 0.6k at t = 1/4 (Fig. 2, right).
Table 3. #Gaussians and sRGB PSNR as the exposure drops (3 seeds)
| t = 4 | t = 2 | t = 1 | t = 1/2 | t = 1/4 | |
|---|---|---|---|---|---|
| SN (τ 0.0025, best at t = 4) | 2.6k 36.27 dB | 2.9k 30.90 dB | 3.2k 25.95 dB | 4.2k 21.96 dB | 12.8k 16.90 dB |
| SN (τ 0.0035, best at t = 2) | 1.8k 35.86 dB | 1.8k 32.43 dB | 1.4k 27.73 dB | 1.8k 23.50 dB | 3.5k 19.05 dB |
| R1 (one setting) | 3.1k 35.58 dB | 2.3k 32.10 dB | 1.5k 28.23 dB | 1.0k 24.15 dB | 0.6k 21.56 dB |
No threshold to tune (an extra benefit). A new scene has no ground truth, so a threshold has to be set once and reused. Each row of Table 4 tunes a baseline on one exposure and applies that threshold to all five; every possible tuning exposure is shown. The shading and the loss columns give the deficit to the best tuned baseline at each exposure (the best entry of Table 1).
Table 4. Threshold tuned on one exposure, sRGB PSNR at every exposure (3 seeds)
| tuned on | t = 4 | t = 2 | t = 1 | t = 1/2 | t = 1/4 | mean loss | worst loss | |
|---|---|---|---|---|---|---|---|---|
| R1 | no threshold | 35.58 | 32.10 | 28.23 | 24.15 | 21.56 | 0.28 | 0.69 |
| L1 | t = 4 (τ 1.25e-5) | 33.76 | 30.89 | 27.19 | 23.08 | 18.51 | 1.92 | 3.26 |
| L1 | t = 2, t = 1, t = 1/2 (τ 5e-5) | 31.84 | 30.99 | 27.95 | 24.22 | 21.17 | 1.37 | 4.43 |
| L1 | t = 1/4 (τ 2e-4) | 31.86 | 29.97 | 27.18 | 23.75 | 21.39 | 1.78 | 4.41 |
| SS | t = 4 (τ 0.01) | 35.51 | 30.89 | 27.58 | 23.79 | 20.60 | 0.94 | 1.54 |
| SS | t = 2 (τ 0.02) | 33.42 | 31.79 | 27.83 | 24.15 | 21.65 | 0.84 | 2.85 |
| SS | t = 1, t = 1/2 (τ 0.03) | 32.99 | 31.67 | 28.24 | 24.33 | 21.53 | 0.86 | 3.28 |
| SS | t = 1/4 (τ 0.05) | 32.61 | 31.31 | 28.00 | 24.28 | 21.77 | 1.01 | 3.66 |
| SN | t = 4 (τ 0.0025) | 36.27 | 30.90 | 25.95 | 21.96 | 16.90 | 2.21 | 4.88 |
| SN | t = 2 (τ 0.0035) | 35.86 | 32.43 | 27.73 | 23.50 | 19.05 | 0.89 | 2.72 |
| SN | t = 1, t = 1/4 (τ 0.007) | 32.70 | 31.74 | 28.14 | 24.19 | 21.62 | 0.93 | 3.57 |
| SN | t = 1/2 (τ 0.005) | 34.44 | 31.91 | 28.03 | 24.21 | 20.66 | 0.76 | 1.83 |
Darker shading means a larger loss (0 to ≥ 4 dB). Rows that pick the same threshold from different tuning exposures are merged.
Table 5. Loss to the best tuned baseline over all five exposures (range over the choice of tuning exposure)
| mean loss (dB) | worst loss (dB) | mean loss (CVVDP) | worst loss (CVVDP) | |
|---|---|---|---|---|
| L1 | 1.37 – 1.92 | 3.26 – 4.43 | 0.26 – 0.57 | 0.51 – 1.18 |
| SS | 0.84 – 1.01 | 1.54 – 3.66 | 0.10 – 0.32 | 0.29 – 0.88 |
| SN | 0.76 – 2.21 | 1.83 – 4.88 | 0.12 – 0.29 | 0.36 – 0.83 |
| R1 | 0.28 | 0.69 | 0.07 | 0.23 |
The best SN threshold is narrow and moves with the noise level. Tuned at t = 4, SN is the best method there (36.3 dB) but falls to 16.9 dB at t = 1/4. Tuned at t = 1, it loses 3.6 dB at t = 4. Whichever exposure the baselines are tuned on, R1 has the smallest mean and worst-case loss.