In a data center, jobs may have to be served by several database
machines, and the database machines may have a choice of which jobs to
prioritize. Here is a simple example with three job classes, each of
which earns a different revenue on completion, and one of which has to
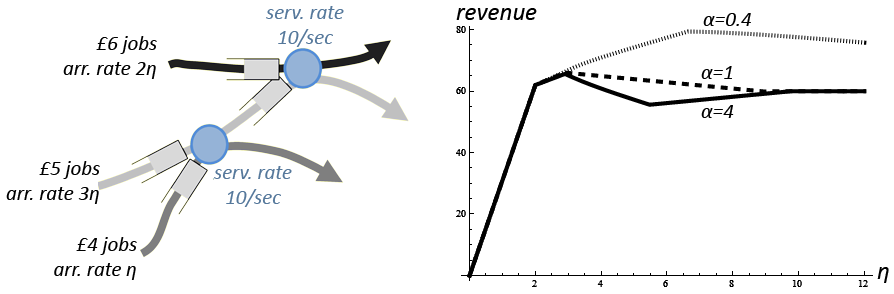
use two machines in tandem. The revenue-maximizing policy is for the
database machines to prioritize £6 jobs, to let through as many
£5 jobs as will get through, and to give the rest of service to
£4 jobs. But this policy requires full knowledge of the network
structure and of arrival rates. On the other hand, the greedy policy
of prioritizing high-revenue jobs ends up wasting effort on £5
jobs which will just be dropped downstream. Is it possible to do
better with a simple myopic algorithm?
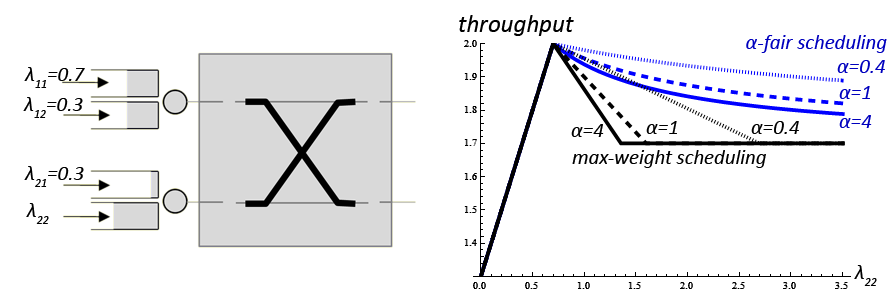
The plot shows what happens when machines use the max-weight scheduling policy with weight function f(qi)=revenuei qiα. (This is a myopic policy.) The plot shows the rate at which revenue is earned, as a function of load. As load increases, revenue drops. But as α→0, revenue approaches optimal.
See section 4.1 of the paper. Detailed calculations [pdf]