
Graphing exercise
There are two sections to this exercise. The first requires you to correct three graphs. The second requires you to graph two data sets.
Section I - correcting graphs
Each of the graphs in this section has one of more problems that prevents it from being a good graph. For each of the graphs in this section you are required to submit two things:
- An explanation, in a single paragraph, of all the problems with the graph as presented.
- A good graph of the same data.
Graph 1
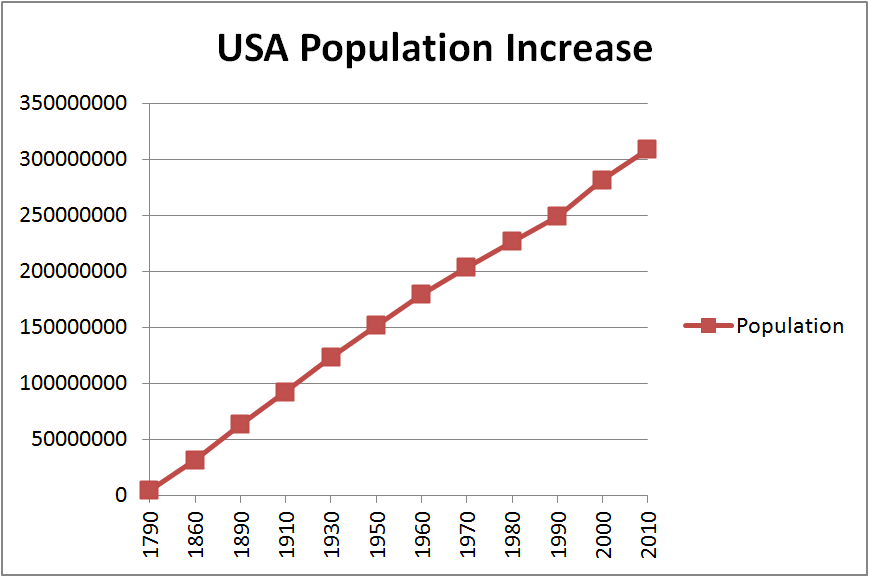
Source: data from US census.
| Year | Population |
|---|---|
| 1790 | 3929214 |
| 1860 | 31443321 |
| 1890 | 62979766 |
| 1910 | 92228496 |
| 1930 | 123202624 |
| 1950 | 151325798 |
| 1960 | 179323175 |
| 1970 | 203211926 |
| 1980 | 226545805 |
| 1990 | 248709873 |
| 2000 | 281421906 |
| 2010 | 308745538 |
Graph 2
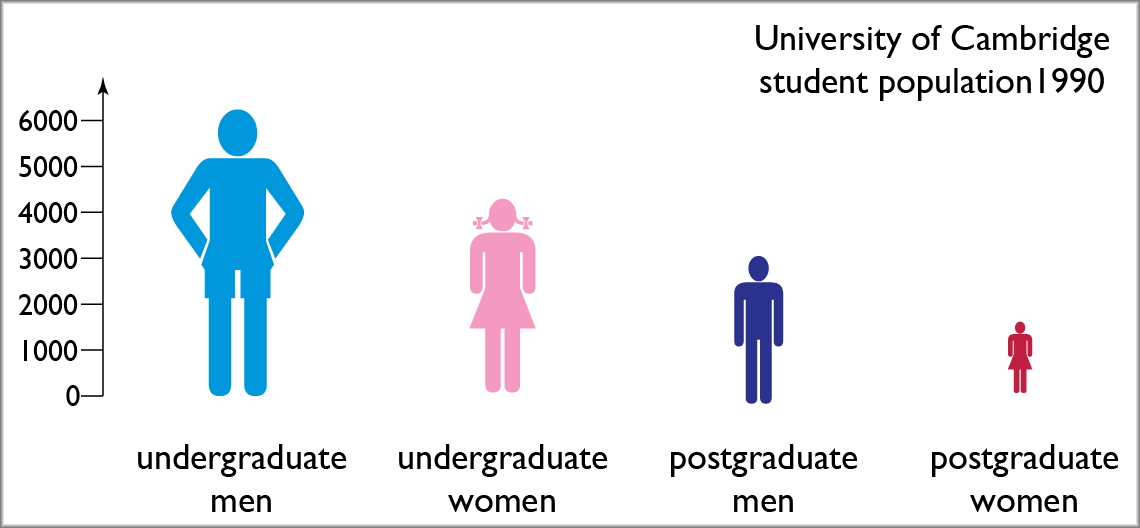
Source: data from Cambridge University Reporter, Special Issue No. 4, 8/10/2009.
Academic year 1990-91
| undergraduate men | 6110 |
| undergraduate women | 4217 |
| postgraduate men | 2516 |
| postgraduate women | 1240 |
Graph 3
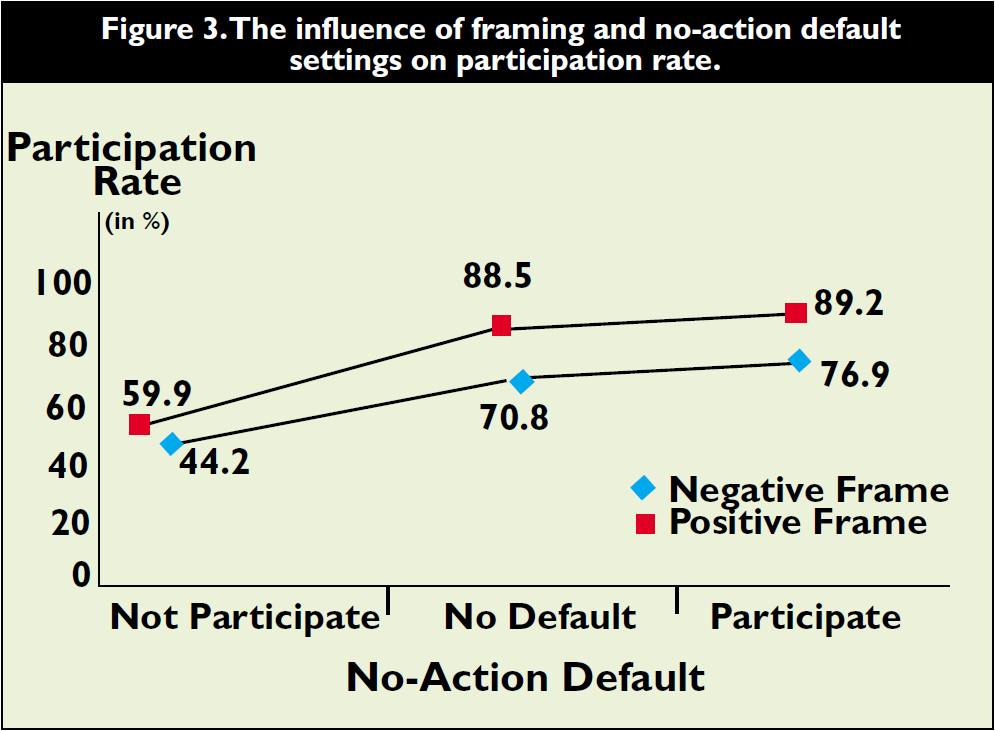
Source: "To Opt-In or Opt-Out? It Depends on the Question", Steven Bellman, Eric J. Johnson, and Gerald L. Lohse, Communications of the ACM 44(2):25-27, February 2001.
| No-Action Default | Negative Frame | Positive Frame |
|---|---|---|
| Not Participate | 44.2 | 59.9 |
| No Default | 70.8 | 88.5 |
| Participate | 76.9 | 89.2 |
Section II - graphing data sets
For each of the following data sets, you are required to submit a good graph of the data and a single sentence that explains the story that you are telling with the graph.
Data Set 4
This data contains the number of citations to thirty different academic papers as reported by the ISI website and by the Google Scholar website. You are to present this information in a way that best shows the relationship between the number of citations reported by the two websites.
The data set can be downloaded as a CSV file.
Data Set 5
This data contains the data on the number of male and female undergraduate and postgraduate students for the academical years 1968-69 through to 2008-09 (source: Cambridge University Reporter, Special Issue No. 4, 8/10/2009). There are five columns of data: the year, UG men (number of undergraduate male students), UG women (number of undergraduate female students), PG men (number of postgraduate male students), and PG woman (number of postgraduate female students).
There are a range of "stories" that you could tell using this data. First, investigate the data. Then choose a particular "story" that you want to tell. Finally, produce a graph or chart that best presents that story. On the graph or chart, write the one sentence that tells me what the "story" is supposed to be.
The data set can be downloaded as a CSV file.