

|
Data CaptureTo capture the data from the installed sensors in the computer lab, a Linux PC reads the main meters through RS485 MODBUS, and produces JSON files of the reported data which are then read by the visualisation tools. More information about the raw data can be found here. Energy VisualisationTo present the data captured by the metering hardware installed into the Computer Lab, we created an app to visualise the energy data of the building. The app presents a hierarchical view of the sensors in the building in both a functional and geographic tree, and allows the user to plot data from individual or groups of sensors, for example; to compare the lighting between corridors, or to find the biggest use of energy by room. 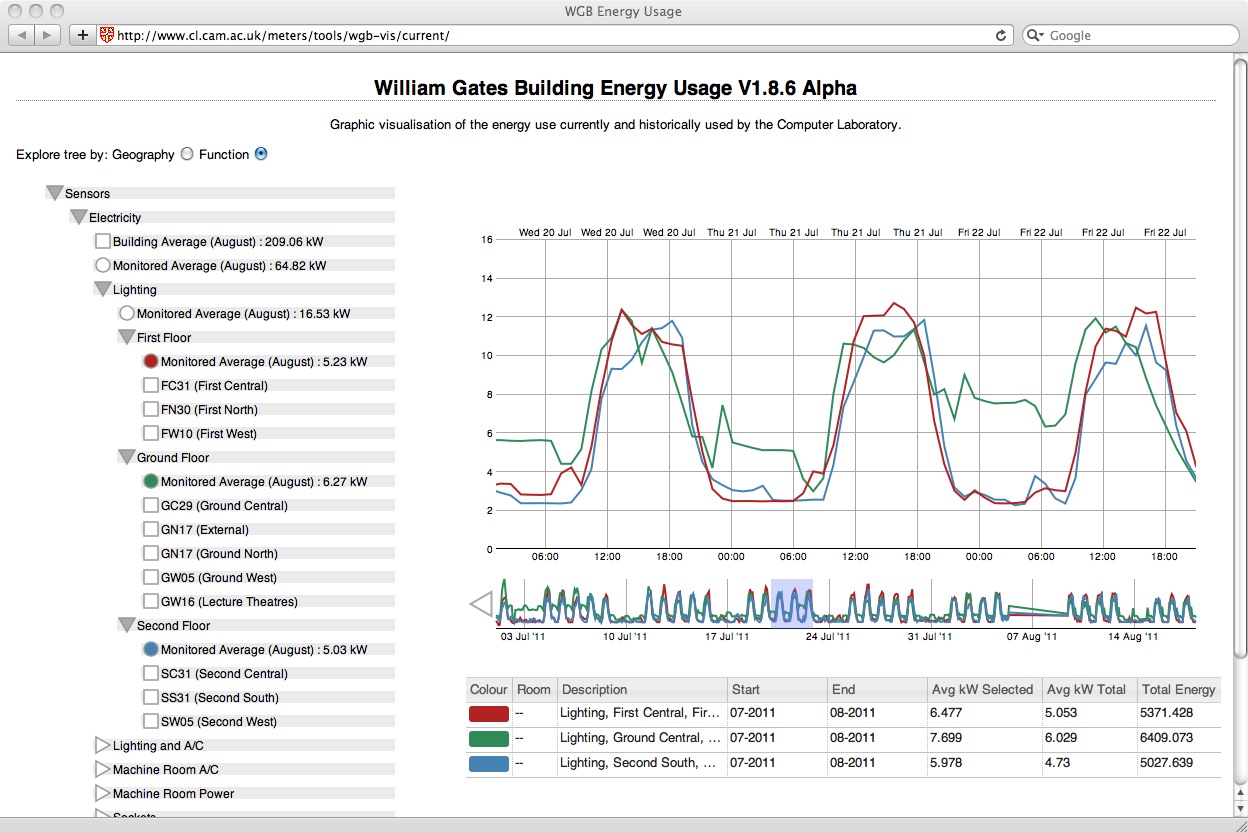
We created a poster to describe the concepts behind visualising this data, and what kind of visualisation are possible here. The visualisation is written in Javascript and can be found here. |