

|
File Formats |
Tree Map Diagrams in JouleTree map diagrams represent energy (or carbon emissions) by rectangles whose areas are in proportion to the quantity being represented. 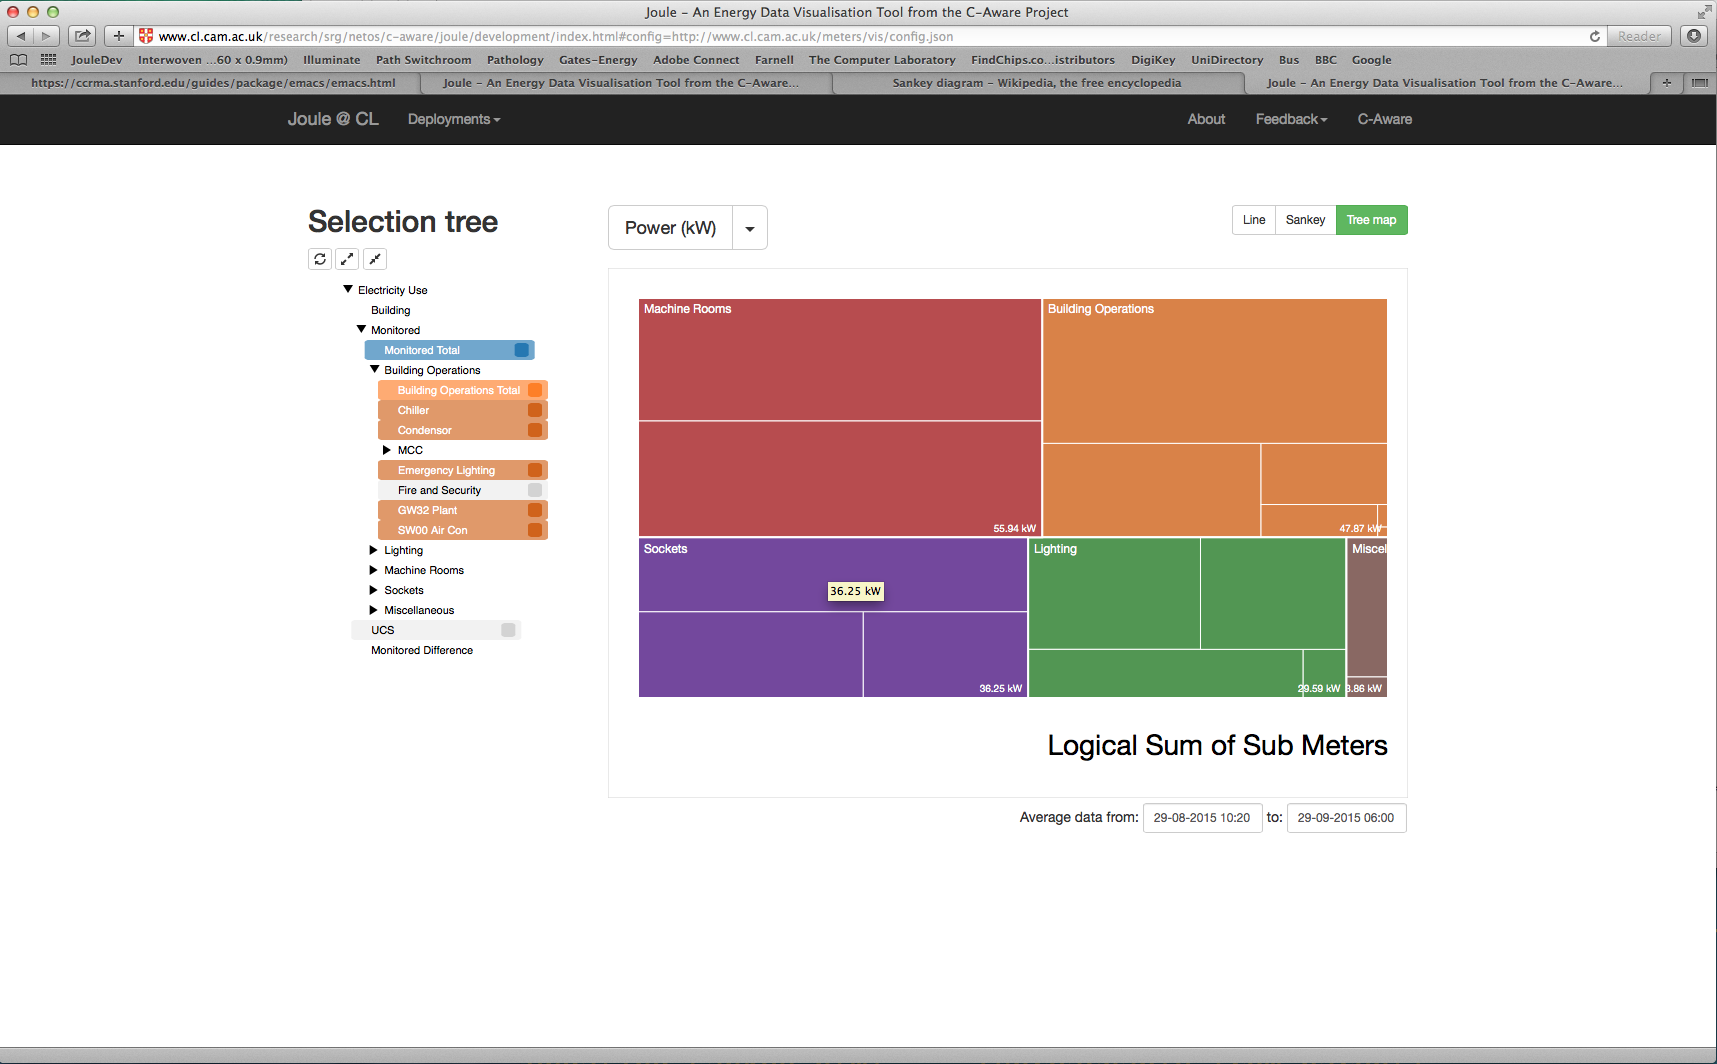
This screen shot shows a tree map diagram. You can dig deeper into the map by clicking on it, e.g. in the shot shown you might click on Lighting to see how electricity for lighting is distributed in the building. If you want to come back up the tree, just click on the title underneath the tree map ("Logical Sum of Submeters" in the example above). |