⇡ Tutorial for the debug preview of lowRISC
Overview of the debug infrastructure
For this release we have set the goal to create the basic debug infrastructure for lowRISC. Before going into the details, we want to give you an overview about where we are heading with the debug infrastructure. Essentially, there are two methods to debug a processor:
With run-control debugging the developer controls the processor core by setting breakpoints and stepping through instructions. This is what most people understand as debugging and
gdbis probably the dominant tool for it.Trace debugging differs from that by sampling the processor execution (program counter etc.) and generating a “trace” of the program execution. Most importantly this happens non-intrusively, meaning there is no impact on the program execution. Especially for multicore system-on-chip, it enables debugging of concurrency issues or performance bottlenecks. Finally, other hardware elements like a DMA or memory controller can be easily extended to generate traces.
While we have support for run-control debugging in the roadmap, we currently focus on trace debugging. So for our first release we have defined the following functionalities we want to support:
Generate a function trace (enter and leave functions) for the program
Allow minimally intrusive software instrumentation with trace events
Memory access and initialization
Reset the system and cores remotely
Serial communication (console) via the debug system
In the picture below you can find an updated overview of the lowRISC system architecture. If you compare it to the previous SoC overview you can see that the major change and main topic of this tutorial is the new debug infrastructure.
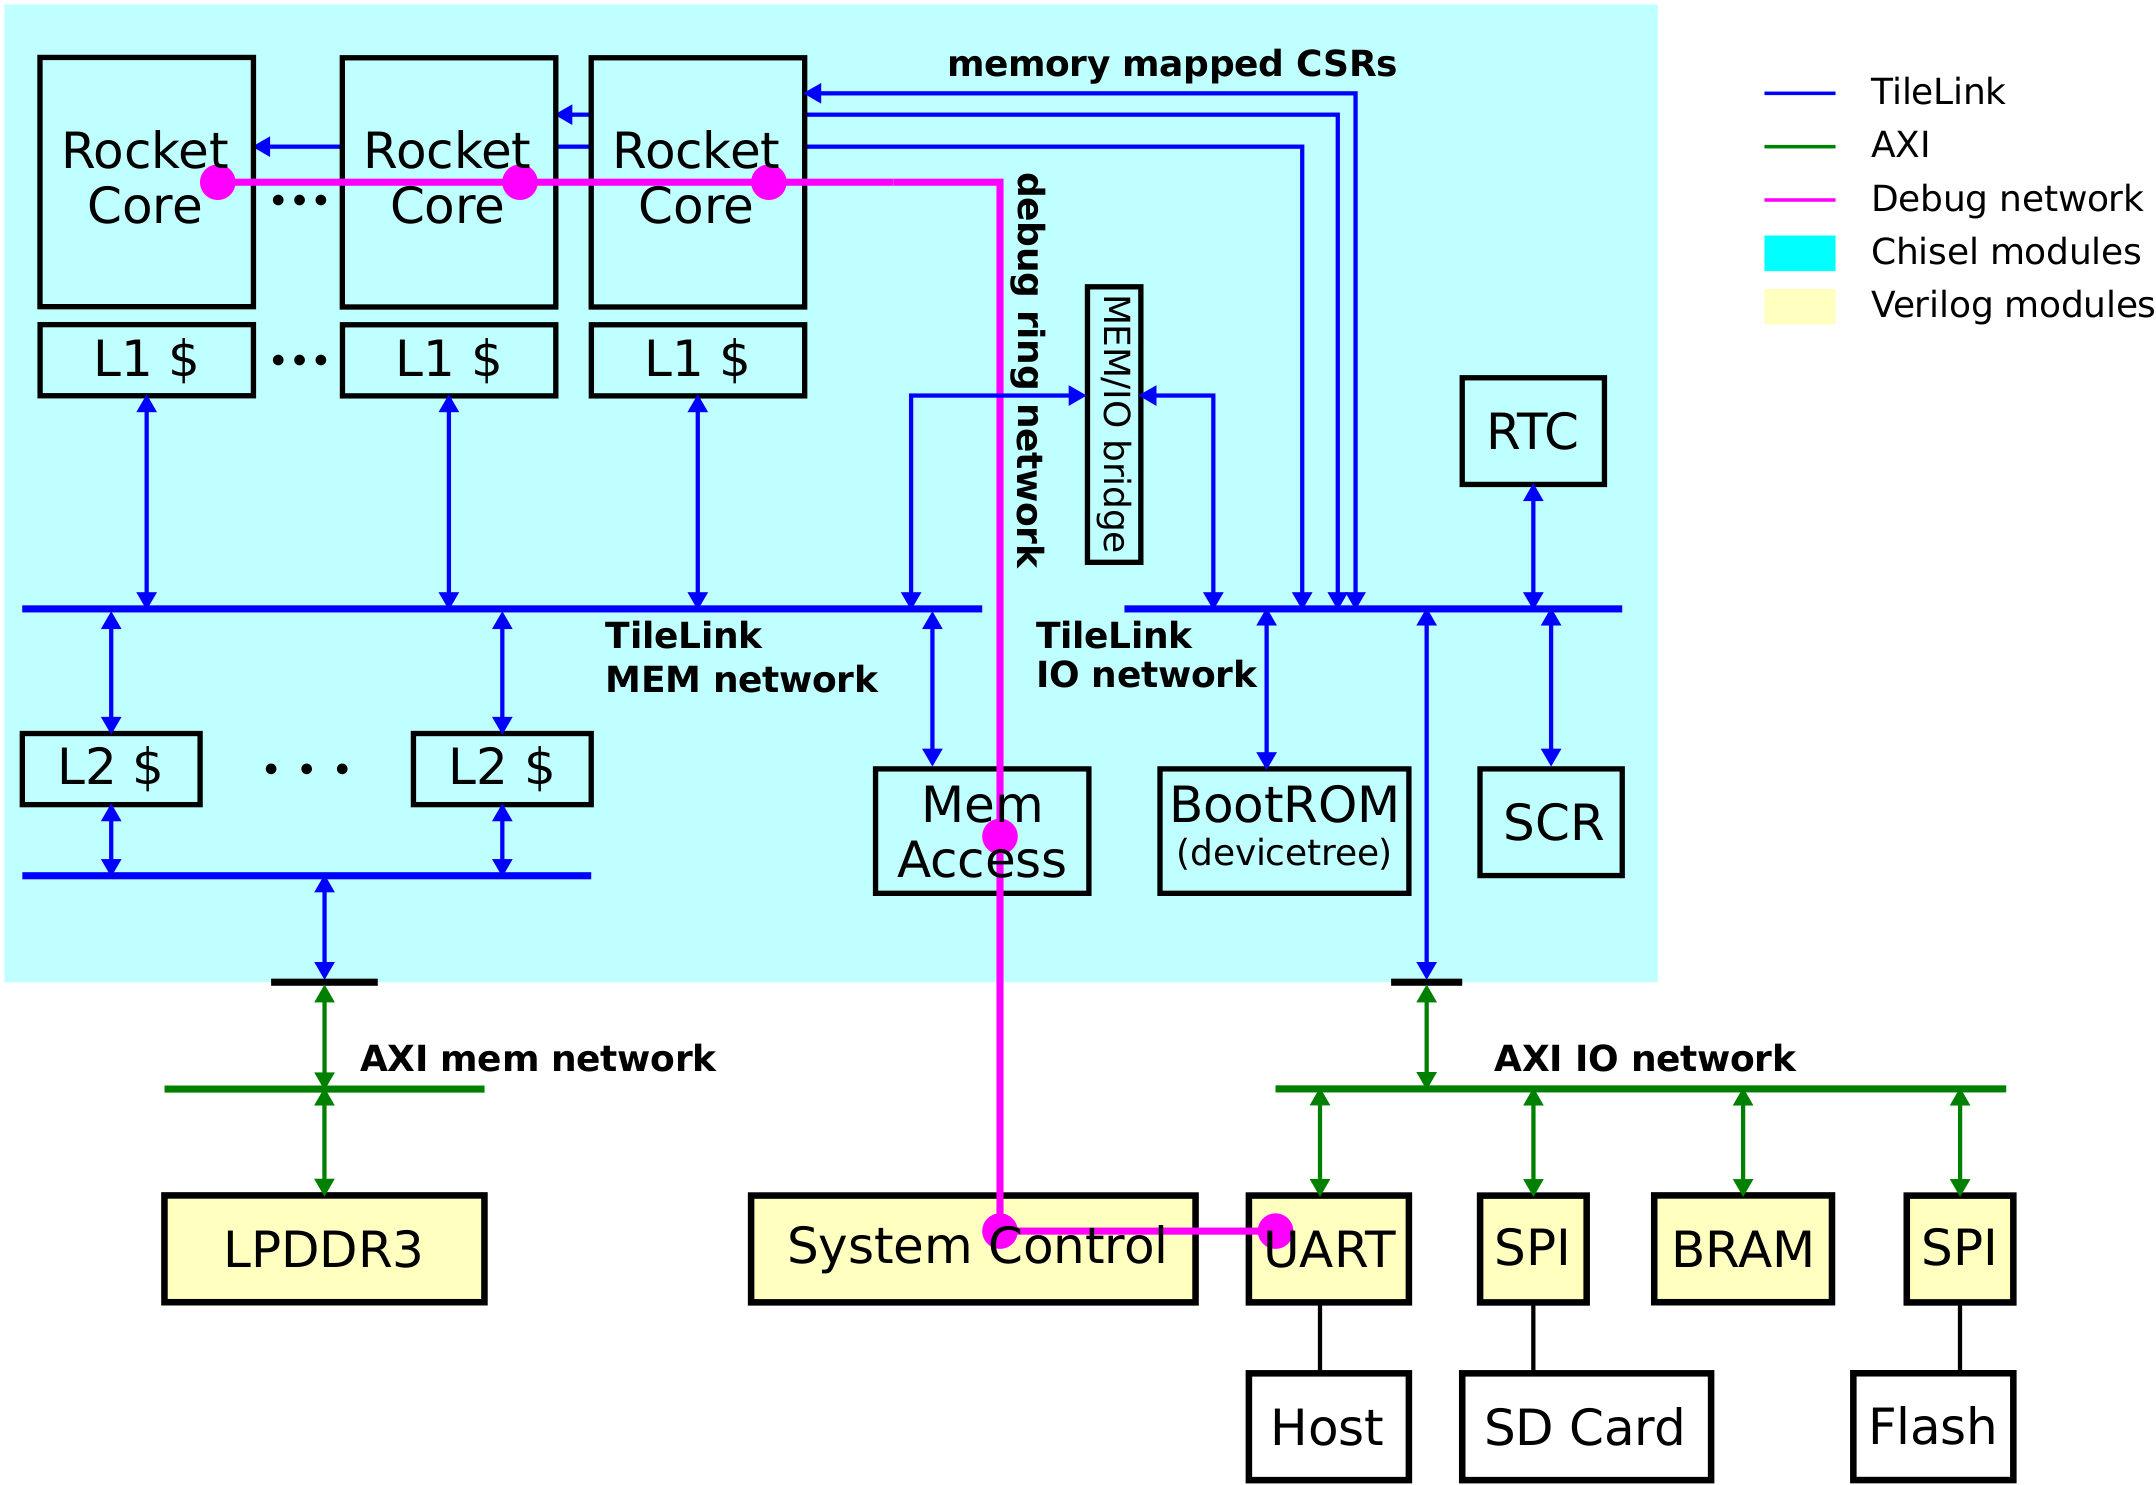
You can find the functionalities covered by modules throughout the system. For best scalability and modularity we decided to connect the debug modules with a separate network. Currently we use one debug ring as a compromise between throughput and resource utilization. The following figure focuses on the debug system.
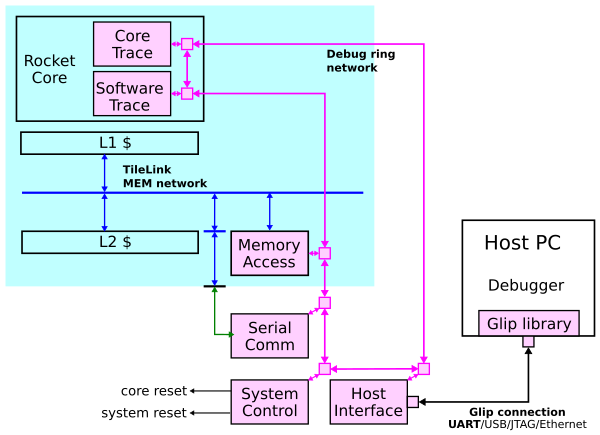
The figure also shows the connection to the host PC that communicates with the debug modules with debug packets. The actual data transport between the host and the debug system is abstracted by using the Generic Logic Interface Project (glip) which provides a simple bi-directional FIFO interface and different physical interfaces like UART, USB and JTAG.
Work on the the debug infrastructure has been produced as part of the Open SoC Debug project, where you can also find a broader introduction. The debug infrastructure presented in this tutorial is just the first step. Before we jump into the details and get some hands-on experience, we want to briefly outline where the debug subsystem is headed:
Once a run-control interface is available for the Rocket core we will include it as a debug module.
Full system traces quickly blow up to multiple gigabyte per second. (Cross-)Triggers and filters help reducing the trace size and focus on the problem.
On-chip trace processing with a (dedicated) minion core can be used to aggregate and process basic trace information to high level information (knowledge).
Trace buffering and output on a separate high speed port or to DRAM broadens the use cases of the debug system.
Please get in touch with us if you have ideas and opinions about future directions we should take. Now it’s time to learn more about the debug system or jump into using it: