⇡ Overview of the debug infrastructure
Debug software and methodology
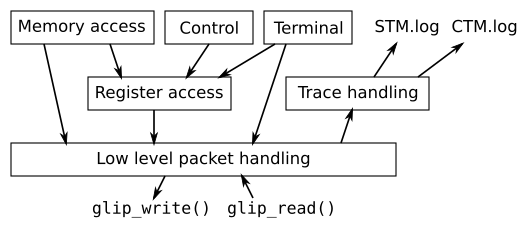
The debug software uses the glip library
(glip API) to communicate with the
target. On top of the basic access functions the Open SoC Debug
library (libopensocdebug) provides the API to abstract from basic
I/O functions. It covers low-level packetization, the proper handling
of debug packets like register accesses and provides the convenience
functions for the different types of modules. The following figure
sketches the different API components.
Debug tools can either use debug by linking to the library or by using the debug daemon, which allows different tools to use the debug system in parallel. For example, a gdb session may be used while a trace user interface is used for plotting the trace events. The daemon spawns a socket for each tool on request and the tools can claim debug features exclusively. The tools also link against the same library, just the initial connection API call varies.
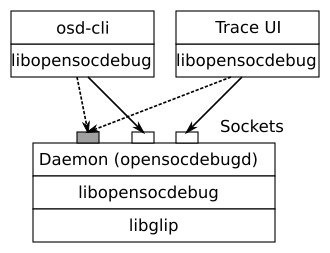
A command line interface (osd-cli) is part of the current release,
that can be used to interact with the debug system. Beside that python
bindings are compiled to easy debug automation. An example generic
script that uses the features from this release makes debugging with
lowRISC really easy:
import opensocdebug
import sys

 if len(sys.argv) < 2:
    print "Usage: runelf.py <filename>"
    exit(1)

elffile = sys.argv[1]

osd = opensocdebug.Session()

osd.reset(halt=True)

for m in osd.get_modules("STM"):
    m.log("stm{:03x}.log".format(m.get_id()))

for m in osd.get_modules("CTM"):
    m.log("ctm{:03x}.log".format(m.get_id()), elffile)

for m in osd.get_modules("MAM"):
    m.loadelf(elffile)

osd.start()