See also slides from talk at Cambridge and
talk at INFORMS 2009.
Abstract.
We consider a queueing network in which there are constraints on which queues may be served simultaneously; such networks may be used to model input-queued switches and wireless networks. The scheduling policy for such a network species which queues to serve at any point in time. We consider a family of scheduling policies, related to the maximum-weight policy of Tassiulas and Ephremides, for single-hop and multihop networks. We specify a fluid model, and show that fluid-scaled performance processes can be approximated by fluid model solutions. We study the behaviour of fluid model solutions under critical load, and characterize invariant states as those states which solve a certain network-wide optimization problem. We use fluid model results to prove multiplicative state space collapse. A notable feature of our results is that they do not assume complete resource pooling.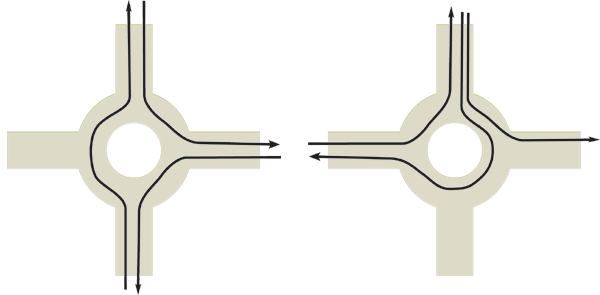
A four-way road roundabout is an example of a switched network.
For example, if there is a steady flow of cars travelling from south to north,
then no cars from the west entrance can enter. These two diagrams show
two possible sets of traffic flows. If each lane can carry at most
x cars per minute, then in the left-hand diagram the roundabout
can carry up to 3x cars per minute, whereas in the right-hand diagram
the roundabout is only carrying up to 2x cars per minute.
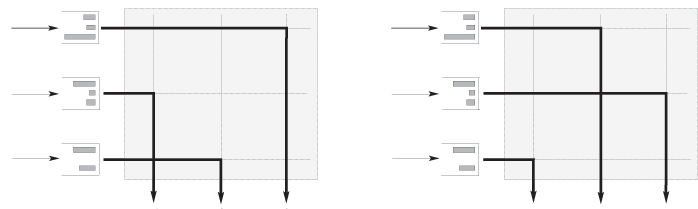
An input-queued switch is the piece of silicon in the heart of
high-end Internet routers. It is an example of a switched network.
This diagram shows an input-queued switch with three inputs and three outputs.
At each clock tick, the switch chooses which inputs to connect to which
outputs, and it sends packets along the connections. The two diagrams here
show two different sets of connections.
The switch chooses the connections based on how much work there is
at each input for each output. In the left-hand diagram the switch has
chosen badly, since it connects the bottom input to the middle output—but there are no packets waiting here to be sent.
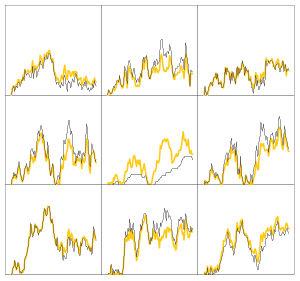
The nine grey lines shows the nine queue sizes,
as a function of time, from a simulation of an
3-by-3 input-queued switch running the maximum-weight matching algorithm.
It turns out that the queue sizes are highly regular.
Although it seems that there are 9 queue sizes to keep track of, they can
in fact be estimated from a 5-dimensional summary statistic. The yellow lines
show the estimated values.
The summary statistic is called the workload vector,
and the map for deriving queue sizes is called the
lifting map.