About Musketeer
Musketeer automatically maps big data workflows to many different processing systems.
- There are too many big data processing systems to understand them all.
Hence, it's hard for users to choose the right system. - Each system encourages lock-in.
Hence, once a workload is implemented for a system, it cannot easily be ported to another.
Many big data systems have been developed in recent years, but it is hard to decide which one is "best" for a particular workflow. In fact, sometimes a combination of systems performs best or uses resources most efficiently.
Few users can tell the precise trade-offs by intuition; and in addition, porting workflows between systems is tedious, making experimentation time consuming. Hence, users often become "locked into" a system after implementing workflows, despite faster or more efficient systems being (or becoming) available.
This problem is a consequence of the tight coupling between user-facing front-ends (e.g. Hive, Lindi, GraphLINQ) and back-end execution engines (e.g. MapReduce, Spark, PowerGraph, Naiad).
We have evaluated a range of contemporary data processing systems – Hadoop, Spark, Naiad, PowerGraph, Metis and GraphChi under controlled conditions and found that their performance can vary widely depending on the workflow. Interestingly, no single system consistently outperforms the others, and almost every system performs best under some circumstances.
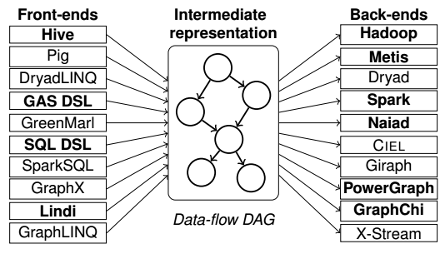
- Musketeer has a common intermediate representation.
As a result, it can map from any front-end framework to any back-end execution engine.
- Musketeer automatically maps workflows to data processing systems.
By combining optimised templates for different data-flow operators, Musketeer automatically generates job implementations that are competitive with hand-optimized baselines.
- Musketeer automatically chooses the right mappings.
Moreover, Musketeer smartly estimates expected performance and automatically chooses a good back-end execution engine (or combination of engines) for a workflow.
With Musketeer, we make it easier for users to experiment with different systems by automatically translating their workflows. In fact, Musketeer can even take decision off their shoulders entirely and guess a suitable system automatically.
Users simply write their workflow in one of the support front-end languages and a smart scheduler chooses the best back-end execution system, or combination of systems, at execution time and translates the workflow appropriately.
Key features
- Multiple front-end languages: complex workflows can be expressed in a variety of declarative ways (SQL-like queries, vertex-centric kernels, etc.)
- Automatic translator: workflows are automatically translated to many back-end data processing systems (currently, Hadoop, Spark, Naiad, PowerGraph, GraphChi and Metis).
- Performance: workflows are optimised, yielding significant runtime reductions without manual optimisation.
- Cost reduction: workflows can also be mapped to more efficient systems, reduces resource utilization.
- One-touch portability: at the touch of a key, Musketeer generates jobs for different systems with no manual porting effort.
- Smart scheduler: automatically decides at runtime which data processing systems to use for a given workflow.
Benefits of using Musketeer
- Dynamic systems binding: Musketeer chooses the right data processing system at runtime, depending on data volume, workflow iterativity and composition, reducing the runtime or resource utilisation.
- Dynamic job boundaries: Musketeer places job boundaries within a workflow at runtime, adding the opportunity to dynamically decompose the workflow differently depending on the data and the availability of different processing systems.
- Flexible adaptation: Musketeer's runtime mapping to data processing systems allows workflows that change over time to adapt dynamically: workflows can be partitioned and mapped differently if they change, or if the properties of data processing systems change (e.g. because of additional optimisations made in new versions of a system).
- Easy job migration: Musketeer makes it easy to port workflows to new systems. Once support for the new system has been added to Musketeer, it can translate workflows onto the new system and schedule them.
Example use case: PageRank
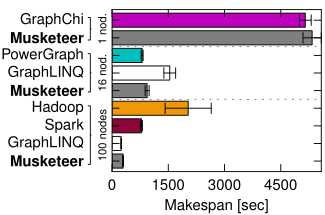
Twitter follower graph (42 million vertices, 1.4 billion edges).
PageRank is a common graph computation that is used to measure popularity of web pages, products or users. In this example, we implemented PageRank and ran five iterations on a Twitter follower graphs in order to compute each user's popularity.
We used five different data processing systems: Hadoop, Spark, PowerGraph, GraphLINQ on Naiad and GraphChi. For each system, we show the configuration that yielded the best results. Hadoop, Spark and Naiad ran on 100 EC2 m1.xlarge instances, PowerGraph on 16 instances and GraphChi on a single instance.
It is evident from the graph that the choice of data processing system has a major impact on performance and efficiency. For example, GraphLINQ on Naiad has the shortest runtime, but uses 100 EC2 instances. PowerGraph only uses 16, but takes only slightly longer (i.e. it is more resource-efficient). However, the absolute best resource efficiency comes from GraphChi, as it only uses a single EC2 instance, but takes less than 100x longer than GraphLINQ on 100 instances.
Musketeer (bold) in each setup manages to generate jobs that perform similarly to the best option. For example, Musketeer generates PowerGraph code when running on 16 instances, and it generates Naiad code on 100 instances.
Musketeer's automatically generated job code (found thatpcialls adds 5-20% overhead. This is despite the code being generated entirely automatically, with the user specifying merely a simple SQL-like or Gather-and-Scatter (GAS) workload description.