Abstract
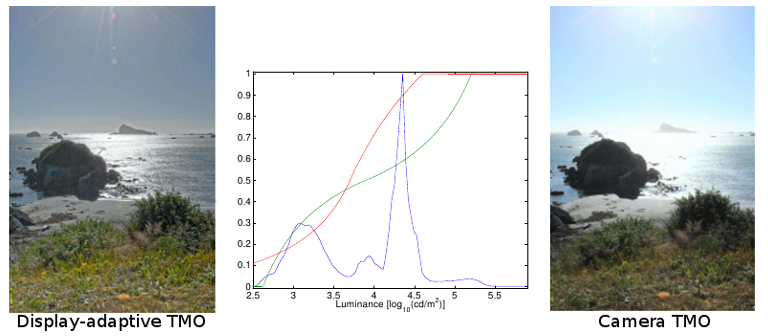
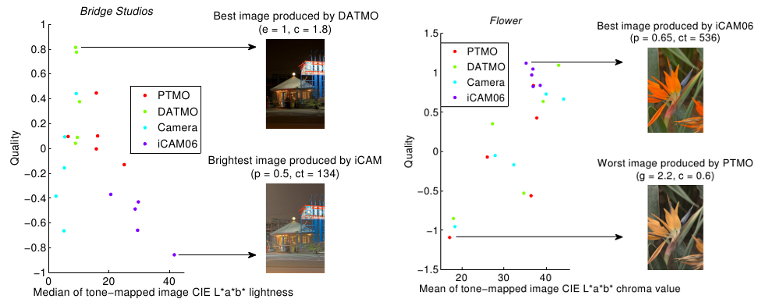
The performance of video tone-mapping operators is investigated in a rating experiment using two criteria: overall quality and fidelity to real-world experience. The study includes a tone-curve used in commercial cameras, rarely considered in tone-mapping evaluation studies. The quality is measured for a range of parameter settings, revealing the importance of parameter fine-tuning and often unsatisfactory results of the default operator parameters. In order to explain what makes best performing operators better, the results are analysed in relation to image statistics and the characteristics of the tone-mapping function. Our observations are: state-of-the-art tone mapping produces measurably better results than camera's S-shaped curve for high dynamic range scenes with important content spanned across a wide dynamic range; differences in colour reproduction strongly affect the results; fidelity and quality criteria produce similar results when no reference is present; and state-of-the-art operators produce the results of comparable quality when their parameters are well selected.
Paper
- Assessment of video tone-mapping: Are cameras' S-shaped tone-curves good enough?
Josselin Petit and Rafał K. Mantiuk.
In: Journal of Visual Communication and Image Representation (in print), 2013
(PDF)