
Extract from Blackwell, A.F. (1998).
Metaphor in Diagrams
Unpublished PhD Thesis, University of Cambridge.
Those weird designs, they only show
What's going on in weirder minds,
Cause when you doodle then
Your noodle's flying blind.
Every little thing that you write
Just conceivably might
Be a thought that you catch
If while caught in a wink.
Doodling takes you beyond what you think
Then you draw what you feel.
Doodlin' - Horace Silver
The experiments described in the previous chapter found large differences in performance between experts and novices, but only small relative changes in novice performance as a result of using metaphorical notations. The apparent lack of educational benefits is disappointing. It is possible, however, that the notations used the wrong kind of metaphors.
In experiment 1, evidence from think-aloud protocols suggested that novice programmers paid little attention to implicit visual metaphors, yet regarded the problem in less abstract terms when using a physical metaphor. These findings concur with some of the intuitions of visual programming language designers and users - one of the themes that I found in the surveys of chapter 3 was the claim that visual languages would reduce the degree of abstraction required in programming. Diagrams may help users avoid abstraction by depicting an abstract concept in terms of physical experience (Lakoff 1993). Alternatively, diagrams may be more computationally tractable because they have less potential for expressing abstraction than symbolic languages (Stenning & Oberlander 1995).
We can thus distinguish between diagrams in which the components illustrate a simple physical metaphor, as in experiment 1 and 2, and diagrams whose geometric structure acts directly as an alternative concrete metaphor for some abstract structure. The latter is more like the case of an electrical schematic where the possible set of causal relationships is constrained by the connection paths in the diagram.
In experiment 1, participants appeared to use fewer abstract terms when using an overtly metaphorical pictorial notation. It is possible that an increased level of visual detail constrains the representation to refer to a specific situation, rather than an abstract set of potential situations. It is for precisely this reason that pictures have long been considered not to be abstract representations; Berkeley's early 18th century theory of vision (1705/1910) distinguished between the visible abstractions of geometry and perceptual experience of the real world. Bartlett quotes Napoleon as distrusting the use of mental images: "those who form a picture of everything are unfit to command" (Bartlett 1932, p. 220). Modern work in cognitive psychology has also observed that mental image-based strategies are unable to represent indeterminacy (Mani & Johnson-Laird 1982), and that generalisation from multiple examples requires the translation of descriptions from images into verbal abstractions (Goldberg & Costa 1981) - the consequent loss of these visual-turned-verbal abstractions has been observed in psychiatric patients during left hemisphere ECT suppression (Deglin & Kinsbourne 1996).
The inability of mental images to support abstraction is considered by Stenning & Oberlander (1991, 1995) to be their principal advantage, because reducing the range of possible interpretations (they call this specificity) makes reasoning with a diagram more computationally efficient. Restricting the range of interpretations can also be a disadvantage, of course. Pimm (1995) believes that using concrete representations in mathematical settings may prevent children from forming necessary abstractions. Other theories, however, emphasise that mental images are at least more abstract than visual percepts because they do not specify all possible details (Paivio 1971, Miller 1993). This observation has also been made of representational conventions in drawing (Arnheim 1970) and of diagram use (Wang, Lee & Zeevat 1995).
If diagrammatic images are interpreted metaphorically, which of these possibilities would be the most relevant? The interpretation of metaphor is itself a process of abstraction from one situation to some interpretive domain (Verbrugge & McCarrell 1977, Gentner & Wolff 1997), but this abstraction makes metaphor difficult to understand because of the range of potential interpretations (Winner & Gardner 1993). If images could be used as intermediaries when interpreting metaphors (Beck 1978), this might provide the advantage of specificity - constraining potential interpretations. In fact, many theories of metaphor comprehension propose that mental images are central to use of metaphor (Cacciari & Glucksberg 1995, Gibbs & O'Brien 1990, Kaufmann 1979, Walsh 1990). Tentative proposals have been made of a functional relationship between the cognitive resources applied in diagram use and metaphorical image use (Lewis 1991, Lakoff 1993), but these have not been as confident as the claims made by computer scientists about the benefits of HCI metaphor.
The use of strategies based on mental imagery to solve verbal problems has historically been one of the central issues in the mental imagery debate. Much of the existing research into diagram use appears to have been motivated by entrenched positions in that debate, as reviewed by Blackwell (1997b). This discussion can only briefly summarise that review, which considered experimental tasks involving picture naming (e.g. Potter & Faulconer 1975), identity judgements (e.g. Theios & Amrhein 1989), evaluating sentences about diagrammatic situations (e.g. Clark & Chase 1972) and problem solving (e.g. Frandsen & Holder 1969, Schwartz 1981). Blackwell also reviewed the main theoretical positions in the debate (Kieras 1978, Pylyshyn 1981, Kosslyn 1981) and some of the philosophical approaches to resolving it (Dennett 1981, Goodman 1990, Sloman 1995).
The most convincing evidence in the imagery debate has come from purely visual tasks such as mental rotation (Shepard & Metzler 1971) and map construction (Kosslyn, Ball & Reiser 1978), but many experiments have investigated the diagrammatic use of images to represent logical propositions (Huttenlocher 1968, Shaver, Pierson & Lang 1974/75, Mani & Johnson-Laird 1982, Fuchs, Goschke & Gude 1988, Matsuno 1987). Many computational models of mental imagery have been constructed as supporting evidence that images can be used for logical reasoning (Lindsay 1988, Greeno 1989, Glasgow & Papadias 1995), as well as for reasoning about the abstract structure of physical situations (Koedinger & Anderson 1990, McDougal & Hammond 1995, Novak 1995, Gardin & Meltzer 1995, Forbus 1983, Faltings 1987, Blackwell 1989).
The most ambitious claims found in the surveys of chapter 3 extend well beyond such restricted problem-solving activities, however. Some researchers apparently claim that all software design problems are solved by thinking in images, and that visual programming languages directly facilitate the solution process. This intuition is consistent with the introspections of programmers who use conventional languages (Petre & Blackwell 1997). Several other studies have also found evidence for use of mental images during software design (Gilmore & Green 1984a, Buckingham Shum et. al. 1997, Green & Navarro 1995, Saariluoma & Sajaniemi 1994).
When mental images are reported by expert programmers, the activities they refer to are not simple problem-solving, but large-scale design. The processes of system design in programming have more in common with other design disciplines, such as engineering and architecture, than with the type of experimental tasks described earlier in this review. Ferguson (1992) has described the way in which the development of modern engineering depended on the ability to publish pictorial representations of engineering designs. Ferguson, along with many eminent engineers whom he quotes, believes that engineering designs are constructed as mental images, and that communicating those designs depends on non-verbal representations. Similar claims have been made regarding the use of visual representations in architecture. Goel (1992, 1995) challenges the computational theory of mind on the basis that it cannot account for the way that architects use sketches, as documented in protocol studies of architects at work by Goldschmidt (1991, 1994) and Suwa and Tversky (1997). Fish and Scrivener (1990) have proposed a general model of the use of sketches in creative design - they claim that perception of sketches interacts directly with mental imagery to enable creative problem solutions.
The use of both visual representations and mental images to discover creative solutions has also been proposed as a fundamental mechanism of scientific discovery (Dreistadt 1968, Gooding 1996, Nersessian 1995, Qin & Simon 1995), as well as in other fields of creativity (Koestler 1964, Shepard 1978, Johnson-Laird 1988). It has even been proposed that almost all problem solving involves structural analogies constructed from mental images (Paivio 1971, Kaufmann 1979). Recent experimental investigations of this proposal have concentrated on a single question, however: once a mental image has been formed, is it possible to reinterpret this image in order to discover new properties? This question is crucial to proposed models of image-based creativity, and highly relevant to the theories of engineering and architectural design described above. Finke, with various colleagues, has carried out a series of experiments in which he has found evidence for discovery of new structure in images when subjects are shown apparently unrelated elements, then asked to combine them in working memory (Finke & Slayton 1988, Finke, Pinker & Farah 1989, Finke 1996). Other experiments, however, have found that memorised ambiguous images cannot be reinterpreted, although the subject can later reproduce the image on paper and then reinterpret their own drawing (Chambers & Reisberg 1985, Slezak 1992, Walker et. al. 1997).
The experiments in this chapter investigate the way that diagram use interacts with mental imagery during design tasks. It addresses several of the questions that have been discussed in this introduction, but concentrates on their relevance to diagram use, rather than speculating on general properties of mental images.
Is there any evidence that diagrams are direct expressions of image-like mental representations? One way to investigate this question is by analysing external signs of cognition associated with both diagrams and imagery. Brandt and Stark (1997), for example, found that the same sequence of gaze fixations was involved in imagining a simple diagram as in observing it. A second alternative is to use dual-task studies: if a certain task has been observed to impair the formation of mental images (presumably, but not necessarily, because it uses the same cognitive resources), will that task also impair the planning of diagrams? This experiment takes the second approach; if diagram planning is impaired by the secondary task, we can infer that diagrams express image-like mental representations.
It also addresses two further questions arising from experiment 1 by using tasks that may involve different encodings in working memory. The first is related to the possible distinction between physical information and abstract information. Experiment 1 suggested that pictorial representations may cause physical information to be emphasised rather than abstract information. Previous research into working memory has found experimental and neurological evidence that spatial information is encoded separately from categorical information (McNamara 1986, Mecklinger & Muller 1996, Kosslyn et. al. 1989) but also that the two are combined when abstract information must be memorised in association with a spatial context, as when functions are assigned to buildings on a map (McNamara, Halpin & Hardy 1992). It seems likely that visual material presented in diagrams involves both categorical and spatial information. Must a combination of abstract information within a spatial metaphor hence rely on different working memory resources?
The second working memory question arising from experiment 1 is the distinction between encoding the spatial arrangement of the elements in a diagram and encoding their visual appearance. Just as there is strong evidence for separate working memory resources for categorical and spatial information, there is also substantial evidence for a distinction between the visual and spatial components of working memory, including neurological (Farah et. al. 1988), developmental (Logie & Pearson 1997), anatomical (Mishkin, Ungerleider & Macko 1983) and functional imaging (Smith & Jonides 1997) studies, as well as evidence from conventional cognitive experiments. An example of the latter is the report by Tresch, Sinnamon and Seamon (1993) that memory for objects or for location is selectively impaired after tasks involving colour identification and motion detection respectively. In experiment 1, the mental animation process that was postulated as a basis for analysing pictures of a physical machine can be identified as primarily visual, while the process of arranging nodes and connections into a complete diagrammatic solution is primarily spatial.
There is a diverse spectrum of hypotheses relating the two distinctions: coordinate/categorical and spatial/visual. It is quite possible that there is only a single representational dichotomy, but that it is simply poorly understood. Either distinction, however, may be relevant to the current investigation - the distinction between abstract and physical information, or between pictorial metaphor and simple geometry, might easily interact as a result of their respective working memory requirements. This experiment addresses these questions by considering separately abstract and physical situations, and by using separate secondary tasks that exercise either visual or spatial short term memory.
The notation used in this experiment was designed to be as simple as possible while maintaining the visual dataflow metaphor introduced in experiment 1. It was intended for use by participants with no experience of computer programming, without requiring that they learn any computational concepts. The form of the notation was nodes connected by arcs, as in experiment 1, but these were given only minimal semantics. Four different types of node were defined, but these had no semantic implication - I told participants that they could choose whichever node they liked, and use them to stand for anything they liked. Each node type included a selection of terminals to which arcs could be connected. Terminals on the left hand side of a node were described as "inputs", and those on the right hand side as "outputs", so that flow implicitly proceeded from left to right, even though (as in experiment 1) I never explicitly mentioned flow. Each terminal could have any number of arcs connected to it.
As in experiment 1, there were two forms of this notation, each with identical semantics, but with different pictorial images representing nodes and arcs. The first of these used simple geometric shapes, connected by plain lines, shown in figure 5.1.
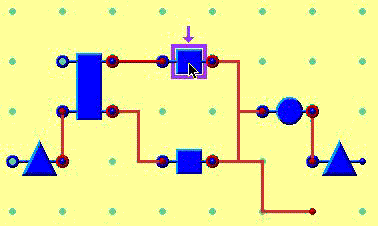
Figure 5.1. Simple geometric nodes and arcs
In the second form of the notation, nodes were connected together by images of cylindrical ducts (actually miniaturised bitmap images produced from digitised photographs of air-conditioning ducts). The nodes themselves were also small photographic images, designed to be obviously mechanical, and plausibly producing flow through the attached ducts, but without having any identifiable function. They were produced from digitised photographs of air conditioning components and garage tools, but the original devices would only be identified by an experienced engineer - participants in the experiment did not recognise them. This implicit data flow version is shown in figure 5.2.
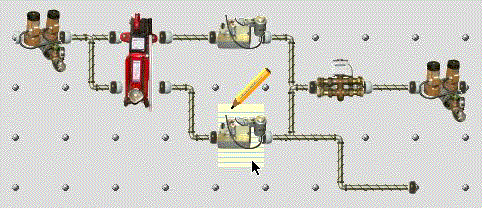
Figure 5.2. Mechanical nodes and arcs with implicit data flow
Participants created diagrams by manipulating the appropriate set of nodes with an editor on a computer screen. The editor screen is illustrated in Figure 5.3. The editor included a palette in one corner with four different node images; participants created new nodes by clicking on any one of these images with the mouse. Nodes could be moved to any location on the screen by clicking in the middle of the image, and dragging it. Connections between nodes could be made by dropping one node so that its input coincided with the output of another node, or by clicking on the output of one node, and dragging from there to the input of another node. If the node at either end of a connection was dragged to a new location, the arc would move to follow it.
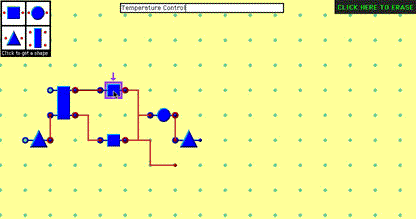
Figure 5.3. Simple node and arc editor
Most participants in this experiment had little experience of computers, and some had never used a mouse before. To make it easier to arrange nodes and connect them together, the screen was therefore divided into a grid of points with approximately 1 cm spacing, as shown in Figure 5.3 (for the geometric version, the grid was simple dots, while for the pictorial version, it resembled a grid of rivet heads on a steel plate). When a node was moved to a new position, it would "jump" to the nearest location on the grid. This made it relatively easy to connect terminals together - the participant only needed to click within the 1 cm2 region around the terminal.
The editor also included an "erase mode" allowing nodes or arcs to be removed (the erase mode button is at the top right of figure 5.3). If the participant moved the mouse cursor over any shape on the screen after selecting erase mode the shape would turn into a cloud containing the words "click me"; clicking would then erase it. When not in erase mode, clicking on a node caused a selection box to be drawn around that shape. For the geometric version, this was a simple box and arrow, and for the pictorial version, it was a piece of paper and a pencil. The participant could assign a label to each node by clicking to select it, and then typing the label. Labels were only required after the diagram was complete, however, as in experiments by Szlichinski (1979).
These various features of the diagram editors are illustrated in appendix B.3.
Participants were asked to use the editor to draw diagrams describing the workings of six different devices. Three devices incorporated moving parts and physical processes, while the other three had no internal moving parts, and only abstract processes. Table 5.1 shows the six devices used and the categories they were assigned to.
| Concrete | Abstract |
| washing machine | telephone |
| motorbike | calculator |
| coffee vending machine | television |
Table 5.1. Abstract/concrete devices
Participants were told that the diagram should show the way that the named device worked on the inside, and should not be a picture of the device.
Participants were also asked to perform secondary tasks while planning their diagrams. The first of these tasks, spatial tracking, was designed to interfere with spatial working memory, as in the motion detection task described by Tresch et. al. (1993). The participant moved the mouse pointer to follow a circle moving slowly around the computer screen with random changes in direction. If the mouse pointer moved outside the circle, the circle changed colour - the participant was instructed not to let this happen (more positive alarms were also tried, but were found during pilot testing to induce excessive anxiety). The exact form of this task was proposed by Professor Alan Baddeley (personal communication 18 June 1996). The second task, visual noise, has been shown by Quinn and McConnell (1996) to interfere with memory for a list of items specifically when subjects are asked to use a visual mnemonic strategy. The participant watched a continually changing random grid of black and white squares. In the third task, blank screen, the participant simply watched a blank screen with a fixation cross in the centre.
The editor was implemented using the animation package MacroMedia Director, version 4.0. I captured the pictorial node and arc images using a Kodak DC500 digital camera, reduced the resolution to 40 pixels square using Adobe Photoshop, and edited them to provide uniform connection points on each node before importing them as bitmaps for use in Director. The animated behaviour of the nodes and arcs in response to user actions was implemented in the Lingo scripting language provided with the Director product.
The experiment procedure was controlled by a presentation sequence implemented in Director. This provided an animated tutorial demonstrating the use of the editor (the tutorial script is reproduced in appendix B.3), then invoked the editor program. The editor program maintained a log of all actions made by the participant, with the system time (reported as the previous whole second) recorded at the time of each action. The experimental software ran on a Macintosh PowerPC 8200/120 computer with a 17 inch monitor displaying a resolution of 832 x 624 pixels at 24-bit colour.
The secondary tasks to be performed while planning diagrams were also implemented as movies in MacroMedia Director. The spatial tracking task was designed to have minimal visual contrast. A dark grey circle slowly followed a randomised path over a light grey field. The speed of motion was kept constant, with the direction of motion changing by small randomised increments. As long as the mouse pointer was kept over the top of the moving circle, it would stay the same colour, but if the participant let the pointer move away, the circle would change to a slightly different shade of grey.
The visual noise task was based on a C program originally developed for the IBM PC by Jean McConnell (McConnell, personal communication 26 July 1996), as used in the research described by Quinn & McConnell (1996). The original program was not reused, but I created a close visual equivalent using the facilities of Director. I first wrote a LISP program to generate a series of images consisting of a grid of black and white squares. In each image the squares of the grid were randomly coloured either black or white. These images were then imported as a sequence of animated frames in Director, with the transition between frames taking place as a random fade, where the fade grid corresponded exactly to the grid of random squares. The result of this was a randomly changing sequence of grid squares practically indistinguishable from the stimulus used by Quinn and McConnell.
Twenty-four participants were recruited from the APU panel of volunteers. None of them had any experience of computer programming. Two further participants were recruited after two of the original cohort misinterpreted the description of the editor palette, concluding that each diagram should have exactly four nodes.
One independent variable was assigned randomly between subjects - twelve participants used the editor with simple geometric shapes and twelve used the pictorial editor with implicit data flow. A second independent variable was the nature of the diagram drawing task. Each participant drew six diagrams, three of which explained physical processes and three abstract processes. The third independent variable was the secondary task performed by the participant while planning each diagram: spatial tracking, designed to interfere with spatial working memory, visual noise, designed to interfere with visual working memory, and blank screen, in which the participant simply watched a fixation cross in the centre of an otherwise blank screen.
The experiment included three dependent variables. The first was the degree of elaboration - the number of nodes in the diagram, as measured in experiment 1. The second was the speed with which the diagram was created - the average interval between addition of new nodes or arcs. The third was the proportion of changes made to the diagram - the proportion of nodes or arcs that were moved or erased after their initial creation.
In order to test the hypothesis of an interaction between the type of editor and the type of process being explained, I tested for different degrees of diagram elaboration for each device type in the two groups. In order to test the second hypothesis, that the secondary tasks would inhibit planning, I compared the speed of creation of the first ten additions to the diagram immediately after the end of the planning period. I also compared the proportion of changes made to the diagram. The third hypothesis of an interaction between the type of secondary task and the pictorial representation or process type was tested in terms of diagram elaboration.
The experiment started with an explanation of the editor functions, at a pace controlled by the participant. The first part of the explanation covered basic mouse operation - clicking on a shape and dragging it from one place to another. This was followed by an animated demonstration of the editor functions, using the appropriate (geometric or pictorial) version of the editor. The secondary tasks were then demonstrated, so that the participant could practise following the moving circle, and see the random grid display. Finally, the participant was asked to draw a diagram as a practise exercise using the editor. The instructions for the exercise specified that the diagram should show how a toaster works on the inside. It stressed that the diagram should not be a picture of a toaster, and that it did not need to look like any part of a toaster - it would simply show how a toaster worked. No further instructions were given regarding the intended use of the nodes and arcs. During this instructional sequence, I sat beside the participant, and answered any questions asked by the participant. Most participants had no questions. Some needed assistance with the procedure for dragging using the mouse. Some asked for clarification of the difference between an input terminal of a node and an output terminal. Some asked for clarification of the instruction that the diagram should show how the toaster works, rather than what it looks like. Several participants were quite anxious about the task, and protested that they would be unable to draw any diagrams. I reassured these participants in general terms, and all of them proved able to draw acceptable diagrams using the editor - it was not necessary to remove any participants as a result of inability to use the editor. During the remainder of the experiment, participants worked on their own, drawing diagrams to describe the workings of the six different devices. The presentation sequence displayed a description of the required diagram, including a reminder that the diagram should show the way that the named device worked on the inside, and should not be a picture of the device. The participant was then given 60 seconds to plan their diagram, during which they had to perform one of the three secondary tasks. The allocation of secondary task to device description was balanced across subjects, and the presentation order of both devices and secondary tasks was also balanced. After the planning period, the editor screen was displayed. The participant then had a period of five minutes in which to draw the diagram they had planned. At the end of the five minutes, they were given a further two minutes in which to type labels for each node in the diagram. During this second period, the node creation and erase functions were disabled. This planning / drawing / labelling sequence was repeated six times by each participant. When participants had completed the diagram drawing tasks, I asked them to complete a debriefing questionnaire. This questionnaire asked:
The analysis approach is a multivariate analysis of variance (MANOVA) with repeated measures, having two within subjects factors (abstract/concrete processes and blank screen/visual noise/spatial tracking secondary task), and one between subjects factor (geometric/pictorial editor). The three dependent variables were elaboration (number of nodes), initial speed of production, and proportion of diagram elements changed. The MANOVA results reported here are calculated using Pillai's Trace method; alternative MANOVA techniques did not result in any difference of significance values.
Initial univariate tests showed that both the editor type and the type of process had significant effects on elaboration F(1,22)=5.74 and 5.81 respectively, p<.05. As shown in figure 5.4, abstract processes were drawn with more nodes (an average of 8.74) than were concrete processes (7.90). Diagrams drawn with the geometric editor were also more elaborate (9.46 nodes) than those drawn with the pictorial editor (7.18 nodes). The hypothesised interaction between these two factors did occur in the predicted direction - diagrams describing abstract processes were more elaborate when using the geometric editor. Although the difference in the means was relatively large, this interaction was not significant F(1,22)=2.33, p=.14. A similar interaction effect was observed for the other dependent variables. Participants constructed the diagram more quickly when using the geometric editor for abstract processes, and they made a smaller proportion of changes to their diagrams, as shown in Figure 5.5. MANOVA analysis indicates that these interactions when taken together are significant, F(3,20)=5.77, p<.01.
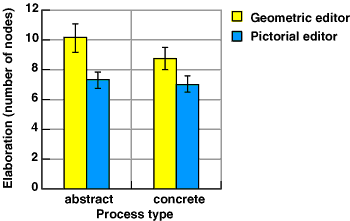
Figure 5.4. Effects of editor type and process type on diagram elaboration
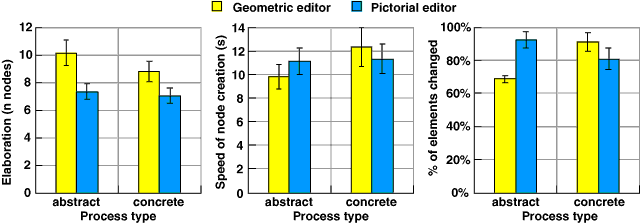
Figure 5.5. Interactions of editor type and process type:
elaboration, speed and number of changes, taken together, show a significant effect
The second hypothesis was that secondary tasks during the planning period would have an effect on speed of production and the proportion of changes made. There was no evidence that the secondary task had any effect on either speed of production F(2,44)=0.034, p=.96 or on proportion of changes F(2,44)=0.116, p=.89. There was also no evidence of the interactions postulated in the third hypothesis - a multivariate analysis of variance found no interaction of secondary task with process type F(6,86)=1.373, p=.51 or with editor type F(6,86)=0.562, p=.21. Univariate ANOVA tests on each variable also found no significant interactions with the secondary task.
When answering the questions in the debriefing questionnaire, only five of the 24 participants said that they had been able to choose shapes in advance while planning the diagram, although a further six said that they could do so occasionally. Twelve of the participants said that it was "not easy", "hard", "difficult" or "impossible" to plan diagrams in advance. The performance of these twelve was then considered separately from the twelve who reported that advance planning was relatively easy. As can be seen in figure 5.6., there was no overall difference between the performance of the groups in any measure, with the MANOVA test result F(3,20)=0.425, p=.73. There were however marginally significant covariances of self-reported planning with the effect of secondary tasks, F(6,82)=2.074, p=.065. Those who reported that it was easy to plan in advance actually performed slightly better (more elaborate diagrams and faster production) when carrying out secondary tasks, while the reverse was true of those who had difficulty planning.
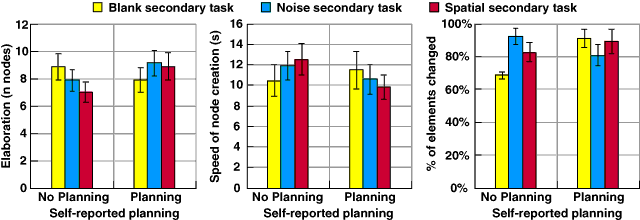
Figure 5.6. Effect on performance of self-reported advance planning
As in experiment 1, there is evidence in this experiment that novices are not completely happy when asked to use pictorial elements diagrammatically. In experiment 1, several participants commented that they found the level of detail in the pictorial notation confusing. At the end of the experiment I showed some of these participants the geometric version of the language, and they claimed that they would prefer to use that version. I also showed two of the participants in the geometric condition the pictorial version, and they said that they would prefer not to use it. This supports the finding of Strothotte and Strothotte (1997), amongst others, who have noted that pictogram users tend to choose more "abstract" symbols such as asterisks or arrows when representing abstract concepts.
In this experiment, the informally expressed preference has been supported by performance measures. Participants were less productive when using a pictorial metaphor to create diagrams than when using simple geometric shapes. This difference was most pronounced in the case of diagrams describing abstract processes. My explanation for this is that participants regard the illustrations as being literal rather than metaphorical, and that this results in incongruity between the task and the notation. No participants commented that they found the pictorial notation inappropriate for particular tasks, but this hypothesis is tested in greater detail in experiment 5.
The main intention of this experiment, however, was to test the way in which choice of notation affects the user's ability to form diagrams as mental images. Only some participants in this experiment appeared to carry out any planning using mental imagery. Secondary tasks during the planning period had no overall effect on speed of production, despite the fact that these tasks have reliably been shown to impair mental images in short term visuo-spatial memory. Those participants who reported that they found it easy to carry out advance planning actually improved their performance when a secondary task was given. It is possible that the plans involved verbal rehearsal rather than images - this is investigated further in experiment 6B, in which some participants were given no planning time at all.
Overall, this experiment found a reduction in performance when pictorial elements were used to describe abstract processes. A further relationship had been expected between performance and the use of mental images for diagram planning, but no clear evidence was found for this.
The different reports regarding advance planning reflect a wider range of individual differences that are relevant to this experiment. The underlying causes of these differences may be complex. Several researchers have reported differences in mental imagery ability correlated with gender (Casey 1996, Delgado & Prieto 1996, Paivio & Clark 1991, Silverman, Phillips & Silverman 1996), handedness, or an interaction between the two (Halpern 1996). Further proposed distinctions include the difference between verbalizer and visualizer "cognitive styles" (Richardson 1977), interaction of cognitive style with handedness (Casey et. al. 1993), cognitive style with gender (Winner & Casey 1992), with age (Johnson 1991) or self reported vividness of mental imagery (Katz 1983). This is a very complex issue, and I found no obvious correlations with (for example) gender in post hoc tests. It is certainly true that there was a wide range of individual variation in performance in this task, and this variation has contributed to the marginal significance of the reasonably large effects observed. Stenning and Gurr (1997) have also observed the difficulty of evaluating external representation use in the face of individual differences such as these.
Van der Veer (1990) has explicitly investigated the effect of cognitive style on the interpretation of software diagrams, but found that individual differences in mathematical experience had a greater effect than cognitive style. Previous experience of mathematics notations has also been identified as a factor in image memory by Winner and Casey (1992) and by Manger and Eikeland (1998). Most of these studies have also noted an interaction of experience with gender or gender image. This is in accordance with casual comments made by many of the female participants in this and later experiments, along the lines of "I'm not much good with mathematical things - you should have got my husband/son to do this experiment".
Participants in experiment 3 were selected on the basis that they had no experience of computer programming - indeed most had little experience of computers, and some had never used a mouse before taking part in the experiment. The training phase did take account of this, and all participants successfully completed the experiment. Nevertheless, the environment was not one with which they were comfortable. This may have caused participants to produce diagrams that were unusually simple. The use of a computer-based editor may also have removed the potential in pencil sketches for discovery through ambiguity, as has been suggested by Goel (1995) in the case of architectural CAD systems. In this related experiment, participants were therefore asked to explain the same devices, but by either drawing diagrams using pencil and paper or writing a verbal explanation.
This experiment retained the minimal prescription of semantic interpretation as in experiment 3. Participants were instructed to construct diagrams by drawing simple shapes and connecting them together with arrows, as if each shape had inputs and outputs. The instructions included three examples of what this would look like - these are reproduced in figure 5.7 (a full reproduction of the instructions is included in appendix B.4). As in experiment 3, participants were given no further guidance regarding how nodes or arcs should be interpreted. Participants were asked to write labels next to each shape, but only after all the shapes in the diagram had been drawn.
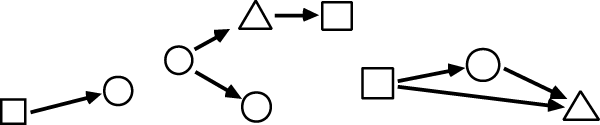
Figure 5.7. Examples of shapes connected by arrows
In a second notational condition, participants were asked to describe devices by "writing an explanation in words". No further constraints were given, other than the constraints of time, and of scale implicit in the size of the paper provided.
Participants in this experiment were asked to describe the same six devices introduced in experiment 3, divided in the same way into three that involved abstract processes and three involving physical processes.
In order to encourage free production of diagrams, participants worked with pencils rather than ink pens. They were not given erasers, however, so that there would be a clear record of any changes they made to their productions. Both the diagrams and the written descriptions were produced on A3 sized sheets of paper. I used a stopwatch to allocate the amount of time provided for each task.
Six participants were recruited from the APU volunteer panel. There were no factors varied between subjects, and two independent variables within subjects. The first independent variable was the instruction to explain devices either by drawing a diagram, or by writing text. The second independent variable was the nature of the devices. The use of three devices of each type, but only two conditions of the first independent variable, produced an unbalanced design. It was therefore not possible to test directly for interaction between the two factors.
Two dependent variables were measured. The first was the number of referents. This was established in diagrams by counting the number of nodes, and in text by counting the number of noun phrases that referred to independent entities. The second dependent variable was the number of relations. This was established by counting the number of arcs in diagrams, and the number of phrases describing any relationship between two referents in the text.
The first hypothesis concerned elaboration relative to experiment 3. It was tested by comparing the number of nodes in experiment 3 to the number of referents described in this experiment. The second hypothesis regarding interaction of writing with abstract device type was measured in terms of the number of referents and relations.
The experimental material was assembled into a booklet, and participants simply worked through this booklet in the order it was constructed. The instructions started with:
|
General Instructions In this experiment, you will be asked to explain what happens inside some thing that might be used around the house. You will be asked to explain what happens either by drawing a diagram, or by writing your explanation in words. Written Explanations When you are asked to make an explanation in words, you can choose whatever way you prefer to write the explanation. Diagram Explanations When you are asked to make the explanation using a diagram, you should make the diagram by choosing simple shapes and joining them together with arrows. The shapes you use should be quite simple - they don't have to look like anything in particular. |
After these instructions, the participant completed a practice exercise, drawing a diagram that shows what happens inside a toaster. A further page of instructions then repeated the instruction that the diagram should "use simple shapes connected together with arrows" and "does not have to look like the thing you are explaining".
Six separate pages of instructions then followed - each naming one of the six devices, and specifying whether the explanation should be a diagram, or written text. Each page of instructions was followed by a blank A3 page on which to draw the diagram or write the text. I restricted the time available both for planning the explanation, and for producing it. The participant was not allowed to start drawing or writing for one minute after reading each instruction - they were told that this time was to be used for planning. At the end of the minute, they were then given three minutes in which to complete the task.
There were two different measures of diagram complexity in this experiment: the number of referents in descriptions, and the number of relations described between them. This was intended to distinguish diagrams that contained the same number of nodes, but were more topologically complex, as there is evidence that this type of complexity may not be represented as a simple image - Chechile et. al. (1996) report that recall of paired associate network diagrams is poorer for more complex diagrams, even when all other aspects of image complexity are rigorously controlled. In fact, only 6 of the 36 descriptions produced in this experiment included more than the minimum number of relations needed to connect all the referents. The numbers of referents and relations are therefore very highly correlated (r=.848, p<.001), with no significant difference (Z=0.52) between the correlation found in diagram descriptions (r=.898) and in text descriptions (r=.854). The remainder of this analysis therefore uses number of referents as the sole measure of elaboration.
My main concern in designing this experiment was to test whether the editors used by participants in experiment 3 might have reduced their productivity in terms of diagram elaboration. I therefore compared the number of nodes contained in diagrams produced in experiment 3 to the number of referents contained in the diagram and text productions of experiment 4. The mean elaboration in experiment 3 was 8.3 nodes, and in this experiment was 8.8 referents. This difference is not statistically significant, whether or not the distributions of the two experiments are assumed to have equal variances, t(52.6)=.738, p=.46. The same devices were described in both experiments, and there was no significant difference in the overall level of elaboration for each device, F(5,174)=1.185, p=.318. There was a large difference between the two experiments for two of the devices, however. As shown in Figure 5.8, the calculator description was less elaborate in this experiment, and the motorbike description was more elaborate, F(12, 168)=84.4, p<.001.
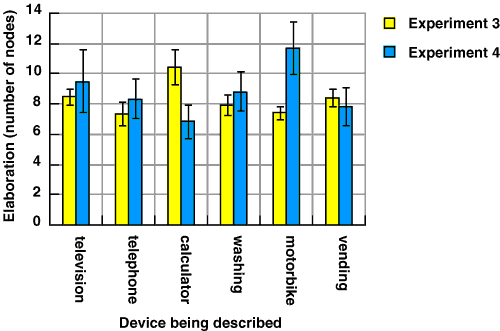
Figure 5.8. Elaboration of device descriptions in experiments 3 and 4
The second hypothesis was that text descriptions would be more suitable for describing abstract devices. As described above, the unbalanced design of this experiment does not allow a repeated measures analysis of this hypothesis. I therefore analysed the complete set of 36 descriptions produced in this experiment as independent observations. Text descriptions did contain more referents than diagrams, as shown in figure 5.9. This effect was statistically significant, F(1,32)=12.65, p<.01. There was not however any significant interaction between the form of the description and the type of device, F(1,32)=0.093, p=.762.
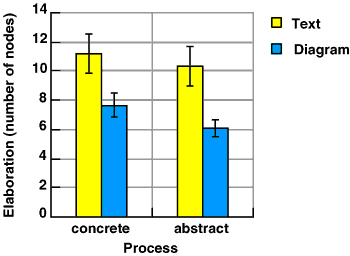
Figure 5.9. Text and diagram descriptions of abstract/concrete devices
The text descriptions produced in this experiment, if considered as an independent group, appear to have a slightly higher level of elaboration than the diagrams produced in experiment 3 (this is shown in Figure 5.10). This demonstrates that other members of the same volunteer population do know more about the six devices than participants in experiment 3 chose to include in their diagrams, t(160)=2.67, p<.01. The diagrams produced with pencil and paper in this experiment do not however differ significantly in their degree of elaboration from those produced in experiment 3, t(178)=0.75, p=.453. This suggests that the computer editors used in experiment 3 did not inhibit diagram elaboration any further than plain pencil and paper do.
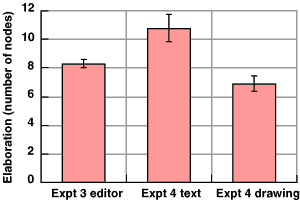
Figure 5.10. Text and pencil diagrams compared to experiment 3
On the basis of these results, it is possible to discount some potential confounds in experiment 3. Firstly, there is no evidence that participants in experiment 3 were especially affected by the use of a computer to draw diagrams - in fact, their diagrams were more elaborate than those produced simply with pencil and paper. Secondly, there is no evidence that participants in experiment 3 were constrained by not knowing enough about the devices being explained - members of the same population were easily able to supply more information about the devices (but in text) than others had done in their diagrams.
This difference in elaboration between text and diagrams has disturbing implications for those who claim that diagrams are "intuitive" in some sense. In a previously published paper I have reported the difference in mean elaboration found in this experiment as "Correction: A picture is worth 84.1 words" (Blackwell 1997a). A more intriguing observation is that part of the difference in elaboration between text and diagrammatic descriptions comes from the fact that participants generally included either themselves or a third person as an actor in their text descriptions. Diagrams describing the same operations almost never included an actor as a node in the diagram. Further investigation of this observation is beyond the scope of this thesis, but it may be of interest when pragmatic conventions of diagram use are studied in the context of applied linguistics (e.g. Oberlander 1996). This observation only accounts for a maximum mean difference of one between the number of referents in text and diagrams; even when subtracting one from the text counts, there is still a significant difference between the level of elaboration in text and diagrams, t(34)=2.67, p<.05.
One further observation can be made about these results on the basis of other research into drawing. Although participants in experiment 3 may have found computerised diagram editors uncomfortable to use, most people also have a very restricted repertoire of representational devices that are available to them when drawing (van Sommers 1984, Edwards 1979, Thomas & Silk 1990, Karmiloff-Smith 1990). In this experiment participants were instructed to use specific symbols in ways that were possibly remote from their usual habits of drawing. The basic elements were only lines and simple shapes, but these do have conventional pictorial implications - whether because of fundamental perceptual mechanisms (Kennedy 1975) or depictive conventions (Willats 1990). On the other hand, most people normally produce even supposedly representational drawings as semi-diagrammatic arrangements of conventional pictorial symbols rather than using a naturalistic style. Snyder and Thomas (1997) propose that these diagrammatic drawings simply reflect efficient abstract codings of the environment, a facility that is absent in the highly naturalistic productions of autistic children (Selfe 1985, Scott & Baron-Cohen 1996). The interaction between diagrammatic and depictive conventions may provide some explanation for the fact that the hand drawn diagrams of novice diagram users in this experiment were less elaborate than either those produced with computers or written text, but firm conclusions would require further investigation beyond the scope of this thesis.
I suggested in the discussion of experiment 3 that the interaction of mechanical and geometric pictures with explanations of abstract and concrete devices may simply result from a perceived incongruity between the task and the notation. Everyone knows that pocket calculators do not contain moving parts, so it requires more imagination to describe one using photographs of complex machinery. Carroll and Thomas (1982) have noted that this type of incongruity can compromise the use of physical metaphors for computer systems. Many theories of metaphor claim that metaphors are made more apt when there is greater separation between source and target domains (e.g. Tourangeau & Sternberg 1982), but this has been challenged by Heydenbluth and Hesse (1996), who found that analogical problem solutions were less elaborate when the source and target domains were dissimilar, even though the problem was structurally identical to another relating similar domains.
In order to test this hypothesis, I carried out a further experiment along the same lines as experiment 3, but with even greater incongruity between the notations provided and the devices to be described.
This experiment is based on the same diagram editor program that was used in experiment 3. Experiment 3 used two different versions of this program: in the first the nodes were simple geometric shapes and the arcs were unadorned lines, while in the second the nodes were photographs of mechanical components and the arcs were ducts (providing an implicit metaphor of flow between the components).
In this experiment there were two further versions of the editor, designed to have no apparent relationship to the devices being explained. The first of these depicted the four different node types as vegetables. The arcs were shown as lines of spring onions arranged between the vegetables. An example of the resulting diagram is shown in figure 5.11.
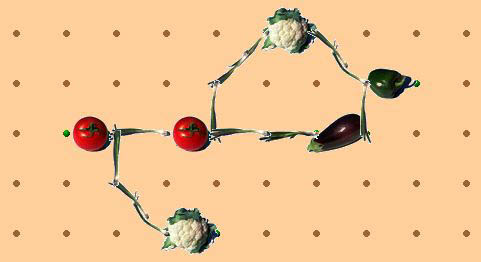
Figure 5.11. Diagram editor based on vegetables
The second new version of the editor depicted the four node types as farmyard animals, and the arcs between them as lines of paw-prints, as shown in figure 5.12.
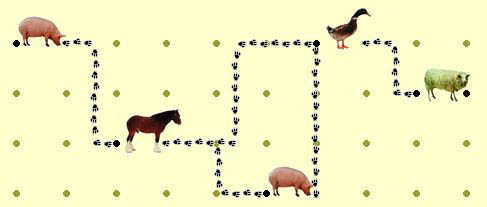
Figure 5.12. Diagram editor based on farmyard animals
The animal editor includes an implicit metaphor of travel between nodes, while there is no such metaphor in the vegetable editor. The metaphor implicit in the animal tracks is more obvious than it is in the mechanical editor, while there is no implicit motion in the vegetable editor. The geometric and mechanical versions of the editor described in experiment 3 were also included as alternatives in this experiment.
As in experiment 3, this experiment compared devices incorporating abstract processes to those incorporating concrete processes. Eight new devices were used, however, and there was a second axis of variation: in the complexity of the device to be explained. The eight devices are listed in table 5.2.
| Complexity level | Concrete | Abstract |
| 1 | pencil sharpener | electric light |
| 2 | construction crane | transistor radio |
| 3 | central heating system | bank account |
| 4 | baked bean factory | British Parliamentary system |
Table 5.2. Second set of abstract/concrete devices
The second and third levels of complexity in these devices were intended to correspond to the range of devices in experiments 3 and 4, while the first level was substantially more simple, and the fourth level as complex as possible while being familiar to a lay person.
The equipment used in this experiment was identical to that in experiment 3: digitised photographs of the node and arc types, edited with Photoshop, and animated in Director. The secondary tasks used in experiment 3 were removed from the program for this experiment.
Sixteen participants were recruited from the APU volunteer panel. There were no between subjects factors, and three factors varied within subjects. The first independent variable was the type of device being explained. As in experiment 3, half of the devices involved abstract processes, and half involved physical concrete processes. There were eight devices altogether, and the second independent variable was the ordinal degree of complexity of the device to be explained - there were four levels of complexity for both the abstract and concrete processes. The third independent variable was the type of diagram used for each task - either animal, vegetable, mechanical or geometric. The allocation of diagram type to complexity and device type was balanced across subjects, producing a balanced confound design as in experiment 4.
A single measure of performance was recorded. As in experiments 3 and 4, this was the degree of elaboration of the diagram, measured in terms of the number of nodes. This measure was used to test both hypotheses.
The procedure used in this experiment was very similar to that of experiment 3. It included an animated explanation of the editor operation, followed by a practice exercise, and then eight device explanation tasks. In this experiment, however, the animated explanation demonstrated the geometric editor to all participants. Participants were then shown each of the four editor variants and given an opportunity to experiment with them, in order to confirm that they all worked in the same way, before starting work on the practice exercise. Unlike experiment 3, there was no planning period (or secondary task) between the allocation of the device to be explained, and the use of the diagram editor.
The eight devices that were explained by participants were designed to incorporate a large range of variation in complexity. They included two extremely simple devices: a pencil sharpener (concrete) and an electric light (abstract). Two corresponded to the least complex devices in experiments 3 and 4: a construction crane (concrete) and a transistor radio (abstract). Two were more complex: a central heating system (concrete) and a bank account (abstract). Two were as complex as possible while being familiar to a layman: a baked bean factory (concrete), and the British Parliamentary system (abstract).
As in experiment 4, the balanced confound design of four levels of complexity with four editor types across only eight tasks did not allow a repeated measures analysis of variance including both factors. Instead, I directly compared effect sizes for the factors of complexity and editor type in a single analysis of all trials. The effect of complexity on elaboration of the diagrams was highly significant, even with this loss of statistical power, F(3,96)=12.67, p<.001. The effect of the editor type and of abstract versus concrete devices was very small in comparison, as shown in Figure 5.13. Neither the effect of editor nor device type reached statistical significance, F(3,96)=1.21, p=.31 and F(1,96)=0.02, p=.90 respectively.
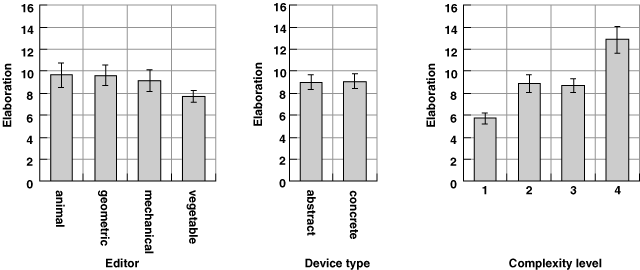
Figure 5.13. Relative effect sizes of complexity, editor, and device type
In order to check for any interaction between the editor being used and the device being explained, I normalised the level of elaboration, relative to all descriptions that were constructed of that device. On this normalised scale, the number of nodes in the most elaborate description of that device was assigned a value of 100, and the number of nodes in the least elaborate description was assigned a value of zero. I then calculated the normalised elaboration of each diagram linearly along this scale. Figure 5.14 shows the relative elaboration for each task/editor combination. As any participant only used one of the four editors for each device, each point on the graph represents one quarter of the total times that device was described, N=4. There are certain editors which seem to produce more favourable results for particular tasks. Farmyard animals can productively be used to describe the British Parliamentary system, for example. These interactions are not statistically significant over such a small number of trials, unfortunately.
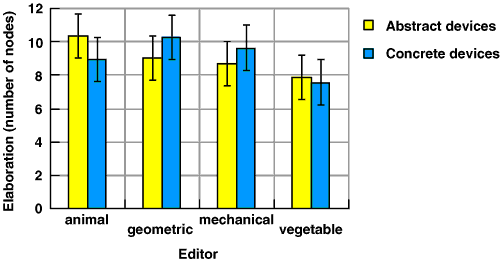
Figure 5.14. Interaction of editor with device type
The normalised scale was used to compare the relative elaboration produced using each editor in the abstract and concrete device sets. There was no significant difference between the editors over all devices, F(3,45)=1.12, p=.352, and no interaction between the abstract/concrete device manipulation and the elaboration produced with any given editor, F(3,45)=0.83, p=.482.
This experiment was unlike experiment 3, in that each participant used a range of different notations. Every participant experimented with all four editors before the experiment started, and was therefore quite familiar with the distinction between the behaviour of the editor (which was the same in all four cases) and the appearance of the nodes and arcs (different in all four cases). This presentation made the distinction between the syntactic conventions and the arbitrary symbols quite obvious. The instructions given to participants in experiment 3 did imply that they were to treat the symbols as arbitrary, by repeating that the diagram did not have to "look like anything". Nevertheless, the experience of using several different symbol sets for the same purpose makes the arbitrary assignment of symbols far more explicit.
The results of this experiment show practically no variation in the elaboration of abstract and concrete device descriptions using different symbol sets. It seems likely that this results from participants consistently treating the symbols as arbitrary decorations of otherwise abstract networks. Sometimes those decorations are entertaining (in the case of the farmyard animals), and hence encourage extra productivity, but I do not believe that those cases reflect any underlying difference in the way that the participant has conceptualised the diagram. Even the geometric shapes may be seen as simply another decoration. As Liu and Kennedy (1994) have observed in recall experiments, even simple geometric shapes such as squares and circles can be interpreted as having metaphorical associations with associated mnemonic benefits for recall of congruent associations. More complex geometric figures have also been found to have uniform semantic associations in different cultures (Pickford 1979, Takahashi 1998), explained by Werner and Kaplan (1963) as "concrete-affective" associations.
Experimental work with children has also shown that they are prepared to regard symbols they know to be meaningful as being arbitrary for the purposes of play. This "pre-object" use of symbols has been observed in children using computer drawing packages (Labbo 1996). It has in fact been shown to impede the discovery of representational relationships between the real world and a physical symbol domain, when children are allowed to play with a model of a room in which a toy has been hidden (DeLoache & Marzolf 1992). These observations lend support to the hypothesis that participants in the present experiment treated the symbols in a more arbitrary way as a result of "playing" with each of the editors during the preparation phase of the experiment.
In the discussion of the previous experiment, I have suggested that interaction between abstract/concrete devices and different symbol types depends on novelty of the symbols. If this is the case, there were no differences in diagram elaboration in that experiment because participants had become familiar with the notational differences and therefore treated them as more arbitrary.
There are several other potential reasons why the interaction found in experiment 3 was not replicated, however. Firstly, the assignment of devices to the "abstract" and "concrete" categories was made on a purely intuitive basis. This approach has been typical of previous experimental work comparing abstract and concrete categories (e.g. D'Esposito et. al. 1997), but the distinction may be more subtle than the experimenter assumes. Experiment 6A tests this categorisation on the basis of reports from 20 independent raters.
Secondly, the planning time provided in experiment 3 may have contributed to the difference observed between abstract and concrete devices. Experiment 5 did not allow any planning time, based on the observation that secondary tasks had not affected diagram production. Participants in experiment 3 may however have found it easier to plan abstract devices in the geometric condition, perhaps using verbal strategies. Experiment 6B tests the effect of planning, in an experiment that is otherwise intended to replicate the results of experiment 3 with a different set of devices.
A third possibility is that the experimental situation included a substantial degree of implicit experimental demand. Participants had a fixed amount of time in which to produce their diagram, and they were working in an unfamiliar environment where the addition of each node may have seemed laborious. Experiment 4 has already demonstrated that the environment itself did not unduly constrain diagram elaboration, but experiment 4 tried to reproduce the other conditions of experiment 3, including a fixed time limit for diagram production. Experiment 6C tests the effect of experimental demand by manipulating the time that participants expect to spend on each diagram.
This experiment used the assessments of independent raters to test the earlier assumptions regarding assignment of devices into abstract and concrete categories.
Participants in this experiment simply assigned an abstract/concrete rating to each of the devices used in the previous experiments. The devices that were rated were all 15 devices that had been used in experiment 3 and experiment 5 (including the practice example; a toaster).
The experimental material consisted of a single page questionnaire. It listed fifteen devices, with a line across the page underneath each one (the questionnaire is reproduced in appendix B.6). The devices were randomly ordered on the page. Each line had a marker at both ends, with the words 'abstract' and 'concrete' marked at opposite ends. Participants made a mark on each line to reflect their judgement of abstractness or concreteness for each device.
Twenty participants were recruited from students registered for postgraduate degrees at Darwin College, Cambridge. All participants completed the same single page questionnaire. The only independent variable was the distinction between the 15 different devices, each of which had been assigned in previous experiments to abstract or concrete categories.
The questionnaire used a single measurement technique. The abstract/concrete judgement was treated as a semantic differential scale - a continuous line which participants could mark at any position. The dependent variable was the position of the mark. The hypothesis was tested by comparing whether those devices defined as being abstract were placed toward the abstract end of the scale, relative to the overall mean.
The questionnaire was distributed to students who were waiting for a meeting to begin. The introduction to the questionnaire described the difference between concrete devices (those that involve moving parts or physical processes) and abstract devices (those that do not). Instructions to the participant asked them to make a mark on each line to reflect their judgement of abstractness or concreteness for each device.
The hypothesis was that those devices defined earlier as being "abstract" would all be placed toward the abstract end of the scale, relative to the overall mean. The scale was 150 mm long. With the abstract end of the scale defined as 0, and the concrete end as 150, the mean point of all marks made by participants was toward the concrete end, at 94 mm. All "abstract" devices from the earlier experiments had mean positions closer to the abstract end of the scale than this, and all of the "concrete" devices had mean positions closer to the concrete end. The toaster, which was chosen as a practice exercise on the basis that it was not too abstract or too concrete, had a mean position of 108 mm: closer to the concrete end than the abstract.
I also compared the relative rankings of the two sets of devices used in earlier experiments. The devices introduced later, in experiment 5, generally received more extreme ratings than those used in experiment 3. Three of the four abstract devices in experiment 5 fell into the first quartile. Only the least complex, the electric lamp, had a more ambiguous position in the second quartile. All four of the concrete devices in experiment 5 fell into the fourth quartile.
This experiment explicitly tested the effect of planning on diagram production, and is also intended to replicate the abstraction effects found in experiment 3 with a different set of devices.
This experiment used only the two diagram editors based on geometric shapes and mechanical components that had been used in experiment 3, rather than the more fanciful animal and vegetable editors introduced in experiment 5.
Participants in this experiment drew diagrams to explain six different devices. These were the six devices that had been found to be either abstract or concrete with the least ambiguity in experiment 6A, as shown in table 5.3.
| Complexity level | Concrete | Abstract |
| 2 | construction crane | transistor radio |
| 3 | central heating system | bank account |
| 4 | baked bean factory | British Parliamentary system |
Table 5.3. Third set of abstract/concrete devices
The equipment used in this experiment was identical to that in experiment 3 and 5: digitised photographs of the node and arc types, edited with Photoshop, and animated in Director. Although a planning period was included, this consisted of a blank screen with a fixation cross in the centre - the spatial tracking and visual noise tasks of experiment 3 were removed from the program.
Sixteen participants were recruited from the APU volunteer panel. I varied two between-subjects factors, and two within subjects factors. The first independent variable returned to the between-subjects allocation of editors as used in experiment 3; each participant used only the editor based on mechanical nodes and arcs or on geometric nodes. The second between-subjects factor was whether or not participants were given time to plan their diagram after learning what it was. Half of the participants were given one minute planning time before starting each diagram, while the other half were given none. The between-subjects factors were balanced across all participants.
There were also two independent variables designed as within-subjects factors. The participants explained six devices; these were classified as either abstract or concrete, and they included three different levels of complexity.
Two dependent variables were measured - the degree of elaboration, measured as the number of nodes in the diagram, and the speed of production, measured as the average time interval between creation of the first ten elements. The first two experimental hypotheses were tested in terms of the effects of device complexity, device abstraction and editor type on elaboration. The third was tested in terms of the effect of planning time on speed of production.
The procedure used in this experiment was almost identical to that of experiment 3, except that participants in the planning condition were not required to carry out a secondary task while planning their diagrams. Participants watched an animated explanation of the editor operation, drew a practice diagram, and then drew diagrams to explain six different devices. Presentation order was balanced as for experiment 5.
The first hypothesis was that the previously observed effect of device complexity on diagram elaboration would again be found. This was in fact observed. The mean elaboration of the six devices is shown in figure 5.15. In testing this first hypothesis, there was a significant main effect of complexity on elaboration , F(2,24)=4.92, p<.05. As before, the abstract and concrete devices at each level of complexity did not result in significantly different levels of elaboration, F(1,12)=1.00, p=.338, and there was no interaction between complexity and abstraction, F(2,24)=0.09, p=.916.
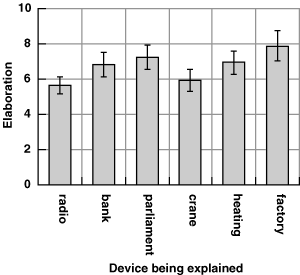
Figure 5.15. Mean elaboration of diagrams explaining six devices
The second hypothesis was that the interaction between device abstraction and the use of mechanical or geometric editors observed in experiment 3 would be replicated in this experiment. The results from this experiment did not replicate that finding. As before, there was no main effect of editor type, F(1,12)=0.51, p=.489. In this experiment, however, neither was there any significant interaction between device abstraction and the editor type, F(1,12)=1.56, p=.236.
The third hypothesis was that providing planning time would increase speed of production in the early part of diagram creation. There was a significant effect of the planning variable on speed, F(1,12)=7.52, p<.05, but this effect was in the opposite direction to that predicted. Participants who were given planning time drew their diagrams more slowly than those who had no planning time. There is an interaction between planning time and device complexity that may help to explain this. As shown in figure 5.16, devices at different levels of complexity are explained with similar degrees of elaboration when no planning time is provided. When participants were given a minute to plan the diagram, they apparently produced diagrams that were elaborated in proportion to the complexity of the device being explained. For the simplest devices, there was a tendency for participants to produce less complex diagrams when they were given time to plan the diagram than when they were not given planning time. This interaction was only marginally significant, however, F(2,24)=4.92, p=.065. <
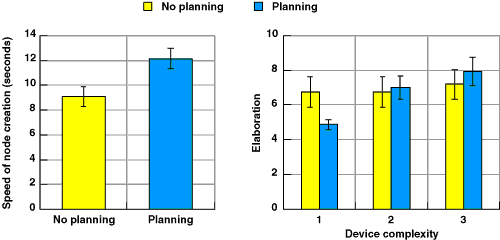
Figure 5.16. Effect of planning time on diagram elaboration and production speed
This experiment tested the effect of experimental demand by manipulating the time that participants expected to spend on each diagram. These results have previously been reported in Blackwell (1997a).
In this experiment participants drew diagrams by hand, as in experiment 4. The instructions given to participants about the form of diagrams were identical to those in experiment 4.
This experiment returned to the complete set of eight devices first introduced in experiment 5. Device abstraction was not considered as a factor in this experiment, so the two simplest devices, although found to be ambiguous regarding abstract/concrete judgments in experiment 6A, were included to give a wider range of complexity.
Participants in this experiment used pencil and paper, as in experiment 4.
Eight participants were recruited from the APU volunteer panel. There were no between subjects factors, and two within-subjects factors. The first independent variable was the degree of complexity of the devices to be explained, as in experiment 5. Device abstraction was not considered as a factor in this experiment. The second independent variable was an implicit manipulation of experimental demand. While drawing four of the diagrams, participants used a stopwatch to monitor the length of time that they spent drawing, providing an implicit concern with speed of drawing. When drawing the other four, subjects were explicitly told that time was not important, and they should make the diagrams as detailed as possible.
There was a single dependent variable - the degree of elaboration, in terms of the number of nodes in the diagram. The two hypotheses were tested with respect to this variable.
The procedure for this experiment was similar to that of experiment 4, in which diagrams were drawn in a booklet containing A3 sheets of paper. The booklet first described the required form of diagram, using the same text that was used in experiment 4. Participants then completed a practice exercise, explaining the internal workings of a toaster.
Participants then drew four diagrams in the speed condition. The booklet asked them to start a stopwatch, draw the first four diagrams, and then write down the time that they had spent drawing. After this, the booklet instructed them to stop the stopwatch and put it away, then spend as much time as they liked drawing four more diagrams, which were to be made as detailed as possible. The presentation order of the eight devices, and allocation of devices to the speed/detailed conditions were balanced across all participants.
The first hypothesis was that the variation in device complexity should result in the same variation in elaboration observed in experiment 6B, despite the fact that diagrams were being drawn on paper rather than with a special editor. As shown in figure 5.17 there was a significant variation of diagram elaboration, in the direction expected with increasing device complexity, F(3,21)=6.57, p<.01.
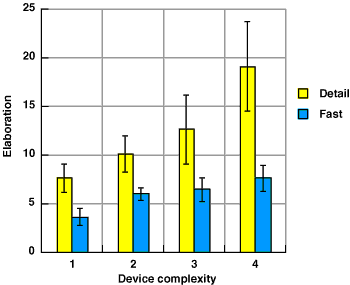
Figure 5.17. Variation in elaboration with device complexity and experimental demand
The second hypothesis was that the effect of experimental demand might be comparable to the effect of device complexity. As can be seen in figure 5.17, the difference in elaboration between the two demand conditions is significant, F(1,7)=13.06, p<.01. There is also, however, a large interaction effect between complexity and demand condition. When participants are working with an implicit time constraint, there is relatively little variation between the elaboration of the least complex and most complex descriptions. When asked to make their diagrams more detailed, participants were able to produce far more elaborate diagrams for the more complex devices. This interaction is only marginally significant, however: F(3,21)=2.97, p=.055.
These three experiments investigated several areas of uncertainty arising from experiment 3, 4 and 5. Firstly, the categorisation of devices into those involving abstract and concrete processes appears to have been quite straightforward. The discovery that the second set of devices (first introduced in experiment 5) were more strongly differentiated than the original set also encouraged the attempt to replicate the original interaction with a different set of devices.
Experiment 6B failed to replicate the result of experiment 3, however. There was no evidence at all in support of the previously observed interaction. This suggests that the interaction observed in experiment 3, if it were to be verified as robust, probably resulted from the specific set of devices used in that experiment. In fact, a single device contributed most of the interaction effect. The pocket calculator was explained to a far greater level of elaboration when geometric symbols were being used; an average of 13.0 nodes, compared to 7.8 nodes in the pictorial condition. This was the largest difference in means for any device, but the interaction over all devices was only marginally significant, F(5,110)=2.24, p=.055. On inspection of the diagrams produced in that experiment, it seems there is a straightforward explanation why the calculator should be a special case. Geometric symbols are readily used to express mathematical operations, so the diagrams produced often included several elements representing each arithmetic operation. The pictorial nodes were used to represent processing, but were less likely to represent individual mathematical operations.
The most surprising result in experiment 6B was that participants drew less complex diagrams when they were given time to plan in advance. This effect appeared to be restricted to the least complex devices, however. It suggests that participants who drew diagrams "on the fly" simply elaborated them until they looked sufficiently complex, rather than thinking in advance about the level of elaboration that was justified. This proposal suggests that the observed effect is due to experimental demand rather than any performance deficit associated with planning. Experiment 6B also confirmed an unusual observation made in experiment 3. In experiment 3, those participants who reported no difficulty with planning actually produced their diagrams more quickly when they were given a secondary task. A similar effect is observed here - when participants were given no planning time, they produced their diagrams more quickly. This suggests that speed of production is not a good measure of whether a diagram has been planned in advance. In this case, lack of planning also resulted in greater consistency between tasks - perhaps because participants resorted to a standard schema rather than planning a more original diagram.
All of the experiments described in this chapter have involved participants describing the operation of some device under time constraints. Furthermore, none of the experiments included any explicit instructions on the level of elaboration that participants were expected to produce. The level of elaboration that they did produce was therefore influenced not only by their knowledge of the device, by their planning strategies and by the tools that they were given, but by the implicit requirements of the experimental context - they were unlikely to expend much more effort on each diagram than they believed was required of them. This factor is likely to have affected all tasks equally, but may have had the effect of reducing the range of elaboration produced. As a result, the manipulations of editor and task characteristics in these experiments may have had larger effects in other circumstances. Despite this caution, if there was an effect of pictorial metaphor or task abstraction in the experiments reported in this chapter, it was too small to be observed. It was certainly far smaller than either the effects of device complexity or experimental demand as observed in Experiment 6C.
Continue reading chapter 6 , or return to table of contents and download information .