
Extract from Blackwell, A.F. (1998).
Metaphor in Diagrams
Unpublished PhD Thesis, University of Cambridge.
The advantages proposed by this mode of representation are to facilitate the attainment of information, and aid the memory in retaining it: which two points form the principal business in what we call learning.
The Statistical Breviary
W. Playfair, 1801, p. 14.
Chapters 4 and 5 have described investigations of two widely held theories of diagram use: that novices can use diagrams as physical metaphors of abstraction to gain expertise, and that diagrams accommodate the use of mental images in problem solving. Neither series of experiments found convincing evidence for the expected strategies, but this does not necessarily mean that the claimed advantage of metaphorical diagrams, as reviewed in chapters 1 and 2, is completely unjustified. Even if metaphors simply provide a mnemonic aid when learning to use a diagram, this could result in substantial improvements in task performance. This could explain the results found in experiment 2, where a nonsensical metaphor may simply have prompted bizarre (but effective) mnemonics.
In experiment 1, I tested for differences in memorability between metaphorical and non-metaphorical diagrams. Of the four novices who used the non-metaphorical version, two of them asked far more often for reminders about component functions. The fact that this effect was only observed for half of an already small experimental group made firm conclusions impossible, but it supports the possibility that metaphors support mnemonic performance rather than problem solving.
The literature certainly includes numerous claims (besides those reviewed in survey 1) that metaphor makes representation systems easy to learn. Payne (1988) describes improved memory for abbreviated command languages when they have a metaphorical explanation, while Simpson and Pellegrino (1993) describe small (10%) improvements in recall when novices use a visual representation involving a geographical metaphor. Where memory for visual representations is concerned, however, it may be the case that any systematic interpretation will improve memory. Bower, Karlin and Dueck (1975) found that reproduction of abstract visual riddles was far more accurate when participants were given a meaningful interpretation of the picture. Liu and Kennedy (1994) found that verbal recall was improved when the words were inscribed within simple geometrical symbols having stereotypical interpretations congruent with the words. Bartlett (1932) also proposed that memory for abstract shapes would be improved by seeing them as real objects.
In experiment 2, participants carried out a combination of problem-solving and mnemonic tasks, using four diagrams composed of abstract shapes. The meaning of each diagram was described either with the addition of a systematic metaphor, or with a nonsensical metaphor. The quality of the metaphor given appeared to make little difference in performance to novice diagram users. This result can be seen as supporting the occasional critiques of metaphor use in HCI. Kieras and Bovair claimed that understanding of complex devices would not be improved by a metaphor or analogy because it is "unlikely to support precise inferences" about specific actions that the user should make (Kieras & Bovair 1984, p. 272). Furthermore, Kieras and Bovair warned that the metaphor might be poorly designed, or that novices may draw invalid conclusions from it, in which case it would impair performance by comparison to more precise instructions. This might certainly have been expected with the nonsense metaphors of experiment 2.
This experiment further explores the result of experiment 2, by introducing a third condition with no metaphor at all. It also modifies the tasks that were used to evaluate diagram understanding in experiment 2. In that experiment, one of the tasks involved completing a diagram by drawing missing graphical elements. The drawing task was least affected by the use of metaphor. It seems possible that some participants treated it as a simple figure reconstruction task, perhaps as a result of having carried out visually similar tasks (such as the Rey-Osterrieth complex figure recall test) in previous experiments encountered during their membership of the APU volunteer panel. If the drawing task had encouraged participants to rely on image-based memory strategies, rather than using the metaphor to interpret the diagram, this might have resulted in a modality-specific interference effect, similar to the finding by De Beni, Moé and Cornoldi (1997) that using the mnemonic method of loci interferes with recall of written texts, but not oral presentations of the same text. Interference of this type might also suggest dual-coding effects (Paivio 1971) governing the mnemonic benefit of the symbols. This is explored further in experiment 9. In the current experiment, the diagram drawing task used in experiment 2 was simply removed.
This experiment used novel diagrams: the four that had been used in experiment 2, and two further diagrams that, as in experiment 2, expressed computational concepts in familiar situations. As for the original four diagrams, the explanation of each diagram could incorporate either a systematic metaphor that compared the graphical elements to some physical situation with an appropriate structure, or a nonsense metaphor that compared them to an irrelevant physical situation. The original four diagrams expressed the following concepts:
The two new diagrams were designed to be at the less difficult extreme of those used earlier. They expressed the concepts of:
The diagram expressing remote execution is shown in Figure 6.1. The task context described a car manufacturing operation, where the manufacture of some parts or sub-assemblies might be subcontracted to other factories. The diagram shows each sub-assembly as a box that can contain other sub-assemblies (a recursive definition). A rectangle without decoration indicates that the assembly will take place in the same location as for the containing box. A rectangle with a "V" marked across the top indicates that the assembly will take place in a different location.
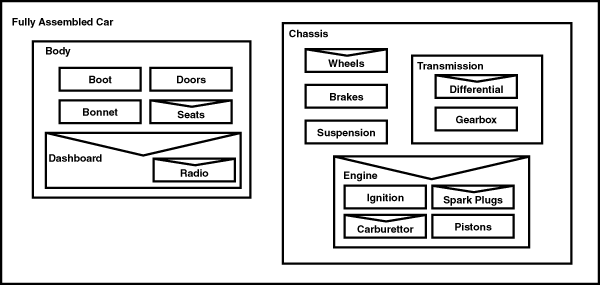
Figure 6.1. Diagram showing remote execution in terms of car manufacture.
Eg: Seats are made in a different factory from the body, but the bonnet is made in the same factory
For this diagram, the systematic metaphor described the plain rectangles as sheets of paper which could be used to instruct the factory workers about assembly operations. The rectangle with the "V" at the top was described as resembling an envelope in which instructions would have to be posted to a different factory if the assembly was being done elsewhere. The nonsense metaphor described the boxes as toolboxes, with the "V" being an open drawer allowing you to see what is inside the box.
The diagram expressing selection is shown in Figure 6.2. The task context described a decision in planning a dinner menu: the decision of whether or not to eat salad depends on the weather, and on whether some combination of appropriate ingredients are available in the garden, at shops or in the refrigerator. The diagram shows contributing factors linked by lines, where several lines can be combined conjunctively (shown as a series of links) or disjunctively (shown as a twisted rod).
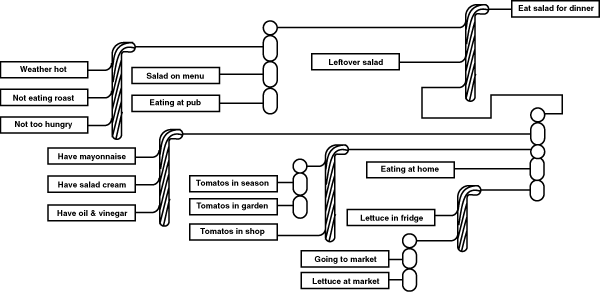
Figure 6.2. Diagram showing selection in terms of menu planning.
Eg: leftover salad or some other combination results in eating salad for dinner
For this diagram, the systematic metaphor described the diagram as a system of strings being pulled. The conjunction symbol resembled a chain - if one link in the chain breaks, it will not pull the string attached to its end. The disjunction symbol resembled a rope - any number of strands can break, but so long as one remains, it will pull the string attached to its end. The nonsense metaphor described the disjunction symbol as resembling a furled umbrella, and the conjunction symbol as resembling a string of sausages.
As in experiment 2, participants answered comprehension questions for examples of each diagram. These questions were phrased to involve an element of problem solving using the notation, rather than simply providing definitions of diagram elements, or reading information directly from the diagram.
In a second task, participants completed incomplete diagrams by writing in missing labels. A list of the missing labels was provided, along with some problem-domain constraints stating where those labels could be placed.
Experiment 2 had also included a test in which incomplete diagrams were completed by drawing, but that task was omitted from this experiment, for reasons explained in the introduction. This also reduced the number of tasks using each diagram from three to two, thereby providing sufficient time in the experimental session to learn six diagrams rather than four as in experiment 2.
As in experiment 2, material was presented to participants in booklet form. Participants wrote directly in the booklet, and used a stopwatch to record the amount of time they spent working on each page. Pages from the booklet are reproduced in appendix B.7.
Twelve participants were recruited from the APU volunteer panel. There were no factors varied between subjects, and two factors within subjects. The first independent variable had three values in this case: diagrams were presented to participants with either the systematic metaphor, the nonsense metaphor, or no metaphor at all. As in experiment 2, the design was a balanced confound, with the allocation of metaphor condition to each of the six diagrams balanced across subjects. The second independent variable was the form of task: comprehension questions or completion of incomplete diagrams.
As in experiment 2, two dependent variables were used to measure performance: the speed with which participants completed comprehension and completion tasks, and accuracy in those tasks. Accuracy scores were again normalised for each task, so that treatment effects could be compared using scores on different tasks. The first hypothesis regarding performance was tested in terms of both shorter task completion times and higher normalised scores.
Participants in this experiment worked through a booklet, as in experiment 2. The first page instructed them to work through the booklet in order, and to write at the top of each page the time that they started work on that page.
The main part of the booklet contained 18 pages: three pages for each of the six diagrams. In each group of three pages, the first page explained the diagram with the appropriate metaphor condition, the second page asked comprehension questions, and the third page asked the participant to complete a diagram by adding text.
The assignment of metaphor condition to each diagram was balanced across participants, as was the presentation order of metaphor condition. The six diagrams were always presented in the same order for all participants, with the least difficult (those that had resulted in the best performance in experiment 2) presented first in order to increase the confidence of participants at the start of the experimental session.
Completed booklets were scored by comparison to ideal worked solutions, and marking was done while blind to the metaphor condition with which diagrams had been explained. Comprehension questions were scored by awarding one mark for each piece of information that was in accordance with the worked solution, and subtracting one mark for any additional pieces of information given, if it was inconsistent with either the problem constraints or the definition of the diagram. Diagram completion tasks were scored by awarding one mark for each label that was in the same place as the worked solution, and subtracting one mark for each label in a place that was inconsistent with the problem constraints or the diagram definition.
The hypothesis for this experiment was that performance with no metaphor would be intermediate between that in the systematic metaphor and nonsense metaphor cases. In fact, there was no significant difference in speed between the three cases, F(2,22)=0.31, p=.735. Furthermore, the mean accuracy in the no-metaphor case was actually slightly higher overall than in either of the other cases, as shown in table 6.1. This difference in accuracy was not significant either, however, F(2,126)=0.37, p=.694.
| Metaphor type | Combined mean score |
| Nonsense | 46.2 |
| None | 51.8 |
| Systematic | 47.4 |
Table 6.1. Mean scores in experiment 7 metaphor conditions
Why might the absence of a metaphor improve performance? Participants might have noticed that the non-metaphorical explanations were shorter than the others in the booklet, and realised that some systematic motivation for the choice of symbols had been hidden from them. They may well have constructed their own explanatory metaphor at this point. A self-generated explanation may even be a superior mnemonic to the metaphor provided in other explanations (as argued in the discussion section below). In order to test this, I compared the time that participants spent reading the diagram explanation. Reading time would normally be shorter in the condition with no metaphor, as the text is shorter. If participants were constructing their own explanations, reading time should be longer for the condition with no metaphor.
Reading times for each metaphor condition are shown in table 6.2. Reading time is in fact shorter for the no-metaphor condition. It is longest for the nonsense condition, suggesting that participants spend more time trying to make sense of the nonsense metaphor. The variances in reading times are very different, however - the variance in reading time is much greater for the metaphor conditions than for the condition with no metaphor. Levene's test for equality of variances confirms that variances in reading times are significantly different: a) when comparing variances of the no-metaphor and systematic metaphor reading time distributions, and also b) when comparing no-metaphor to the nonsense metaphor; F(1,47)=7.25, p<.01 and F(1,47)=12.66, p<.01 respectively. This is in accordance with unsolicited comments made by two of the twelve participants, that they stopped reading the second paragraph of the explanations (the paragraph containing the metaphors). Both of these participants had received a nonsense metaphor in the first diagram of the booklet. Presumably these were so unhelpful that these two participants (and possibly others) decided to discard all the metaphors without further evaluation.
| Metaphor Type | mean reading time (s) | standard deviation |
| Nonsense | 126.21 | 13.944 |
| None | 95.60 | 5.631 |
| Systematic | 104.92 | 12.160 |
Table 6.2. Mean reading times for diagram explanations
This experiment repeats the finding of experiment 2, that systematic metaphors are of little assistance in remembering and interpreting these diagrams. Performance with systematic metaphors is once again similar to that with nonsensical metaphors. These two treatments have more in common, in fact, than a case with no metaphor at all.
In analysing these results, I have considered the possibility that participants may be constructing their own metaphor in the case when none is given. This has previously been found to assist novices learning to use computer systems. Carroll and Mack (1985) describe an unpublished study by Carroll and Lasher, in which learning was improved when users created their own metaphor. Jones (1984) has also noted that novices learning a programming language invent their own metaphors to explain the behaviour of their program by comparing it to other types of software that they are familiar with, such as word processors.
There is certainly clear evidence that some participants in this experiment ignored the metaphorical explanations, presumably substituting their own mnemonic strategies. The range of potential strategies is very large, and is subject to individual variation (MacLeod, Hunt & Mathews 1978, Kaufmann 1979, Matsuno 1987, Riding & Douglas 1993, Sein et. al. 1993) as well as cultural variation (Kearins 1981) and differences in self-image (Katz 1983). This possibility is explored in the following two experiments by asking participants to report, after completing the experiment, what mnemonic strategy they had used for each diagram.
In experiment 7, as in experiment 2, diagram metaphor was assessed in terms of the benefits it would provide in learning to use the diagram for problem-solving tasks. Experiment 7 raised an interesting question regarding the effect of individual mnemonic strategies - some differences in performance appeared to result from mnemonic benefits which may have been mostly obscured by the substantial problem-solving demands in the experimental tasks. A similar distinction between memory and comprehension of diagrammatic material can be found in an experiment by Potter et. al. (1986). Participants were presented with rebus sentences - sentences in which some of the words were replaced by pictures. They then performed both recall tasks and plausibility judgement tasks. Potter et. al. found that plausibility tasks took longer when pictures were included in a sentence, but that recall tasks took the same amount of time. They use these results to argue that semantic judgements involve lexical representations, and that additional time is required to translate pictorial material into lexical form.
The tasks used in experiments 2 and 7 involved a substantial degree of problem solving. If, as Potter et. al. claim, semantic processing of pictorial material is slower than that of verbal material, interpreting the problem statements in metaphorical terms may actually have impaired performance. This could have some bearing on the slight improvement in performance when no metaphor was given in experiment 7.
In this experiment, the tasks were therefore modified to emphasise recall of the instructional material rather than problem solving. All the diagram explanations were given at the start of the experiment, resulting in an interval of around 20 minutes between presentation and test. An explicit recall test, with no problem-solving component, replaced the comprehension questions. The diagrams themselves were also modified, including two new diagram types which emphasised recall of individual symbols rather than complex geometric syntax. In these simpler diagrams and tasks, any potential handicaps arising from semantic access to pictorial material should be reduced, and the residual mnemonic advantages of instructional metaphor should be clearer. The expected mnemonic advantage can again be explained in terms of the experiment by Bower, Karlin and Dueck (1975) that was described in the introduction to experiment 7 - they found that recall of a visual riddle was improved when a pictorial interpretation was given.
Participants in this experiment learned to use novel types of diagram, as in experiments 2 and 7. These included two of the diagrams that had been used in those experiments: one presenting flow of control as a washing machine cycle, and one presenting visibility as telephone availability. There were also two new diagrams. These expressed spatial concepts rather than abstract computational concepts, and the spatial organisation of the diagram had a direct correspondence with the spatial layout of the situation that it referred to. The full explanations of these diagrams, as presented to participants, have been reproduced in appendix B.8.
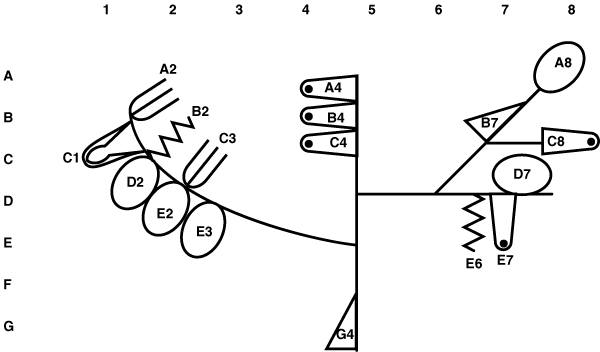
Figure 6.3. Diagram showing gold mine layout
The first of these new diagrams was essentially a map: the two dimensions of the paper were used to show the plan view of a gold mine. The map was schematic rather than pictorial, and it was annotated with symbols indicating what sort of excavation would be required at different locations. An example of the diagram is shown in figure 6.3. The six symbols represent large deposits of gold, individual whole gold nuggets, sprinkled gold powder, rock which must be crushed to yield gold ore, as well as places where it was necessary to cut through rock walls, or removing blockages from tunnels.
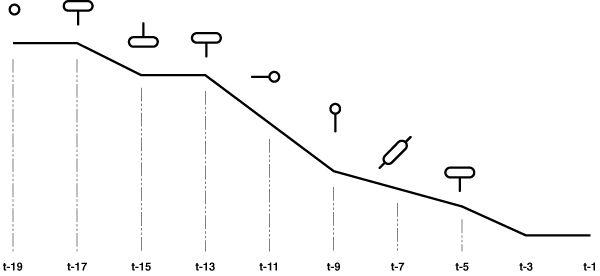
Figure 6.4. Diagram showing aircraft landing approach
The explanatory metaphor for this diagram was created by analogy to the controls of a car. Lining up with the runway was represented by a simple circle like a steering wheel. The symbol for selecting ranges of engine speeds was compared to a gearlever, the symbol for slowing down to a brake pedal, and the symbol for lowering landing gear to a handbrake. The symbol showing when the pilot should check for other planes in the area was compared to a rear vision mirror. Finally, the symbol for turning on landing lights was described as an indicator stalk on the side of a steering column.
The two computational diagrams from experiments 2 and 7 were also modified slightly, so that they also included six different symbols which had to be memorised. I added another symbol to the flow of control diagram to indicate the measurement of some quantity (such as temperature or water level) which might start or stop a process. This symbol was described metaphorically as a gauge. The modified diagram is shown in Figure 6.5.
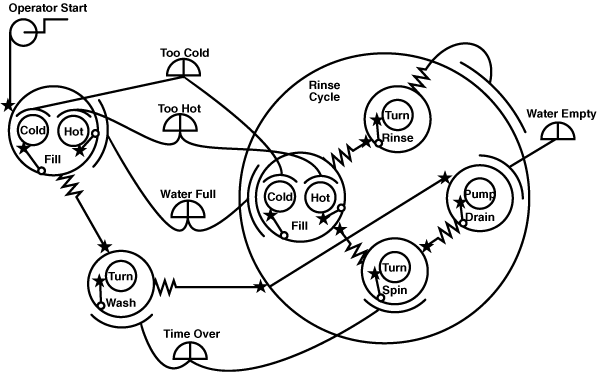
Figure 6.5. Flow of control diagram including six different symbols
The visibility diagram introduced in experiment 2 (and illustrated in appendix B.2.) was used again here. No further symbols were added to it, but the instructions now explicitly described straight lines as a sixth meaningful element (they had previously been treated as default "plain" lines distinguished only because of the fact that they were not dashed). The metaphorical explanations of the two types of dashed line were the same as in experiments 2 and 7. Plain lines were now described as a footpath, along which a postman could walk to deliver messages in writing, as opposed to the higher speed road and rail connections represented by dashed lines.
Memory for the diagram definitions was tested using two different tasks. In the first, participants completed a diagram from which all the symbols had been removed, drawing appropriate symbols according to a set of problem constraints phrased in terms of the problem domain. This task tests both comprehension of the diagram definition and memory for symbol form.
In the second task, participants were shown a set of six symbols taken out of the diagram context, and were asked to write the meaning of each symbol alongside it as a straightforward recall test. All tasks are illustrated in appendix B.8.
As in experiments 2 and 7, material was presented to participants in booklet form. Participants wrote directly in the booklet, and used a stopwatch to record the amount of time they spent working on each page.
Eight participants were recruited from the APU volunteer panel. There were no factors varied between subjects, and three independent variables within subjects, The first independent variable had two levels: the metaphor was either present in the explanation of the diagram, or absent. The second independent variable was the nature of the diagram. The two new diagrams both map space in the diagram to a concrete physical dimension: to the ground plan of the gold mine, or to altitude along the flight path. The two diagrams expressing computational concepts only use space topologically to represent abstract relationships. These two factors form a latin square, but the allocation of metaphor/space conditions to diagrams was balanced across participants, producing the same balanced confound as in experiments 2 and 7. The third independent variable was the type of task used to test memory for the diagram definitions; the completion and recall tasks described above.
There were three dependent variables: the time taken to read the diagram explanation, speed in the completion and recall tasks, and accuracy for the completion and recall tasks. Accuracy scores were again normalised for each task, so that treatment effects could be compared using scores on different tasks. The two hypotheses were tested in terms of these normalised scores.
As in experiments 2 and 7, presentation order was established by order of pages in the booklet. In this experiment all four diagrams were presented together at the beginning of the booklet. These were followed by four diagram completion tasks (in the same order as the diagrams had been explained), and then by the four symbol definition tasks. At the end of the booklet, a page of debriefing questions asked participants to report what technique they had used to remember each set of symbols.
Completed booklets were scored by comparison to ideal worked solutions, and marking was done while blind to the metaphor condition with which diagrams had been explained. Diagram completion tasks were scored by awarding up to three marks for each of the six symbols. One mark was awarded if the form of the symbol was recognised by a rating panel (the organisation of the rating panel is described separately below, under the heading Experiment 8A). A further mark was awarded if the form of the symbol was precisely as in the original explanation (i.e. all elements of the symbol are present and they are oriented correctly to each other). A third mark was awarded if the symbol was included in all the locations where it appeared on the worked solution, and no more.
The symbol definition tasks were scored by awarding up to three marks for the definition of each of the six symbols. One mark was awarded if the definition distinguished the interpretation of this symbol from that of the other five symbols. A second mark was given if the definition was completely accurate. A mark was subtracted if the symbol was given an interpretation that should have been allocated to a different symbol.
One participant in the original group of eight completed the test booklet out of order, after missing the page that provided the initial explanation of one of the diagrams. A ninth participant was recruited to replace those results, and the out-of-order results have not been considered any further.
The first hypothesis was that tasks using the two simpler concrete diagram types would be completed more quickly than those using the abstract diagrams. Task completion times in the different conditions are shown in Figure 6.6. As predicted, participants took twice as long to complete tasks using the abstract diagrams, F(1,7)=12.20, p<.01. There was no main effect of metaphor presence on mean task completion time, and there was no interaction of metaphor with the time taken to complete either type of diagram or either task.
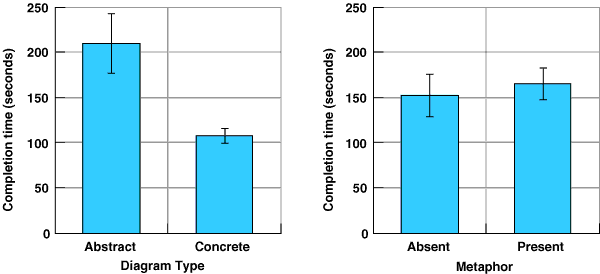
Figure 6.6. Task completion times for each condition in experiment 8
The second hypothesis was that provision of a metaphor would improve memory for the symbols used in the diagram, and that this effect would be larger in the case of the abstract diagram types than for the concrete diagrams. A multivariate comparison of completion time and accuracy (MANOVA) shows a two way interaction between diagram type and recall task performance, F(2,6)=9.96, p<.05 - in the abstract diagrams, accuracy in the symbol recall task was superior to that in diagram completion tasks. For the concrete diagrams, the reverse was true, as shown in figure 6.7. The inclusion of metaphor was apparently associated with a slight improvement in accuracy for recall tasks, and a slightly greater improvement for diagram completion tasks, but neither the main effect of metaphor nor the interaction is significant, F(1,7)=0.29, p=.605 and F(1,7)=0.001, p=.978. There was no improvement at all for abstract diagram types, however. Inclusion of an explanatory metaphor produced improved scores in the concrete diagrams, but actually impaired performance in abstract diagrams, as shown in figure 6.8. This interaction is marginally significant, F(1,7)=5.161, p=.057.
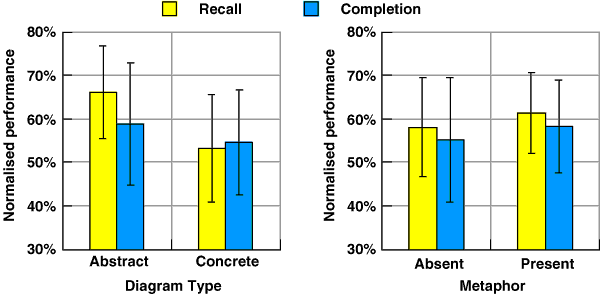
Figure 6.7. Recall and completion performance for each diagram type and metaphor
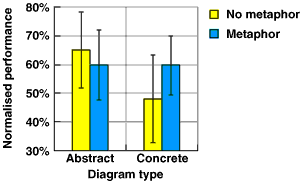
Figure 6.8. Interaction of diagram type and metaphor
As in experiment 7, I also compared the times spent reading the diagram explanations, in order to examine any strategic differences in mnemonic strategies. Reading times were again longer when metaphors were included in the explanation than when they were not, F(1,7)=10.54, p<.05. This is consistent with the fact that the metaphorical explanation texts were longer. Reading times were also longer for abstract diagram types than for concrete diagrams, F(1,7)=19.37, p<.01, but this is not the result of any difference in the length of the texts: it reflects the fact that the abstract diagrams are simply more complex, and take longer to understand with or without a metaphor. Participants tended to spend longer reading explanations of abstract diagrams when a metaphor was provided, as shown in Figure 6.9 - this implies that they did spend time forming a metaphorical model of the more complex diagrams, but the tendency is not statistically significant, F(1,7)=3.75, p=.094.
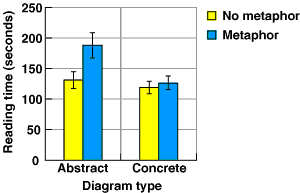
Figure 6.9. Explanation reading time: interaction of metaphor with diagram type
At the end of the booklet, participants reported the method they had used to remember symbols. Of the sixteen diagrams for which no metaphor was provided (two for each participant), participants reported for nine of them that they had constructed their own metaphors. Some of these constructed metaphors appeared to be related to the intentional design of the symbols; for example in the case of the gold mine ("symbols partly look like the job they are doing") or for the flight path ("imagined flying plane"). Other metaphors were completely original; again in the case of the gold mine, the "fork" symbol for picking up individual nuggets was described by one participant as "like a coffee bean (one nugget)" and by another as "rounded like chicken nuggets". Some mnemonic techniques were apparently verbal ("I remembered circle triangle square in order"), and one participant appeared to use synesthetic mnemonics - "a circle was a green go sign and a square a red stop sign" (the symbols were not printed in colour), and "the rock was angular and harsh".
In experiment 8, participants were asked to draw symbols from memory in the diagram completion task. Some of the productions were not immediately identifiable as corresponding to any of the defined symbols. The causes of this inaccuracy may be related to the fact that so many adults are unable to draw what they see. Cohen and Bennett (1997) attribute this to misperception of the object being drawn, resulting from biases in existing knowledge. In children's drawing, the ability to reproduce figures also relies on developing a repertoire of standard components (Fenson 1985) that may not be combined strictly according to the visual appearance of a shape being copied. Whatever the cause of inaccuracy, it is quite possible that some of the inaccurate reproductions in this experiment were influenced by the instructional metaphor. If I had rated these productions myself, my familiarity with the metaphor would certainly have biased my assessment in favour of those that were consistent with the metaphor, thereby favouring implicit recall of the metaphor rather than accurate recall of the diagram. Experiment 8 was therefore followed by this independent rating exercise.
Five raters were recruited from staff and students at the APU. None of the raters had previously seen the diagrams, their definitions or the metaphorical explanations. Each rater was given a set of photocopied pages, each one of which contained one of the sets of six symbols defined for the diagrams, but included neither any verbal explanation nor diagram context. In addition to the six original symbols, the page contained photocopies of all ambiguous productions created during the diagram completion tasks. I asked the raters to decide whether each production corresponded unambiguously to one of the symbols, and if so, which symbol.
In general, the raters were conservative in identifying productions, and judged a relatively large number of symbols to be ambiguous. The majority decision from the five raters was used to score each symbol that had been produced by subjects in experiment 8. The scores based on these ratings are the ones that are reported in the results section for experiment 8.
This experiment introduced two new diagrams where the interpretation of the diagram involved a simple spatial correspondence between the diagram layout and the problem domain, rather than a more complex abstract syntax. Tasks using these diagrams were completed far more quickly, reflecting the relative simplicity of representations based on spatial correspondence. In the more complex abstract diagrams, participants were able to recall symbols, but had greater difficulty in using them to complete partial diagrams. The reverse was true for the simple concrete diagrams - performance on completion tasks was improved relative to symbol recall tasks. Experiment 9 further investigates the distinction between symbol recall and structural comprehension tasks.
The effect of the instructional metaphor in this experiment can be considered in terms of this difference between the two diagram types. The metaphor appears to have provided a greater advantage in the case of simpler, concrete diagrams. In these diagrams the problem-solving component is reduced even further, as the metaphor is used mainly as a pictorial mnemonic, rather than as an aid to interpreting the structure of the diagram. In the complex abstract tasks, introduction of the metaphor may even impair performance as a result of the additional demands associated with interpreting the metaphor - these increased demands are reflected in longer reading times.
Experiment 7 discussed the possibility that some participants gained more advantage by developing their own explanatory metaphors, rather than reading an instructional metaphor that was provided for them. The benefits of self-generated metaphor have been reported by Carroll and Mack (1985) and by Jones (1984). In the debriefing questionnaire of this experiment, most participants did report using metaphorical mnemonic strategies even when no metaphor had been provided. These mnemonic metaphors must have been constructed while participants were reading the diagram explanations, but reading times were shorter in the cases where no metaphor was provided. These mnemonic metaphors must therefore have been constructed more quickly than the time it takes to read and interpret an existing metaphor. Furthermore these self-generated metaphors are equally effective as mnemonic devices. This is considered further in experiment 9, where more detailed pictorial content facilitates self-generated metaphors.
This experiment compares the two styles of diagrammatic metaphor that have been considered separately in the rest of this thesis. Experiments 1, 3, 5 and 6 evaluated the results of implicit diagrammatic metaphor: diagrams which incorporate pictorial symbols, but without explicitly describing how those symbols should be interpreted. This is the general practice in the graphical user interfaces of many commercially available software packages, anticipated by the cognitive theories of metaphorical abstract concept representation proposed by Smith (1977). Experiments 2, 7 and 8 investigated explicit diagrammatic metaphors; the intended interpretation was explained using instructional metaphors. Most psychological theories of metaphor use in HCI accordingly consider it to be an instructional device (Mayer 1975, Carroll & Thomas 1982, van der Veer 1990).
This experiment compares diagrams constructed from pictorial and abstract symbols, both with and without explicit descriptions of the intended metaphorical interpretation. The observations of experiments 7 and 8 allow two hypotheses that have not been anticipated by previous theories of metaphor use. The first is that the benefits of metaphor will be mainly observed in improved recall for symbol definitions, but will not improve performance in tasks where structural interpretation of the diagram is the main task component. The second is that implicit pictorial metaphor will provide a greater advantage than explicit instructional metaphor because it will facilitate the construction of self-generated metaphors, which will provide greater benefit in recall tasks.
Participants in this experiment learned to use novel types of diagram, as in experiments 2, 7 and 8. The diagrams used in experiments 2 and 7 expressed computational concepts, while experiment 8 introduced more straightforward spatial representations (goldmine layout, and aeroplane landing path). The two spatial representations from experiment 8 were used again here, along with two new diagram types. These two also relied on conventional usage of space. One expressed spatial layout as a direct mapping. The other presented timelines running from left to right and symbols that associated height with increasing quantity. These conventions have been verified experimentally by Gattis and Holyoak (1996), who reported reduced accuracy when the conventions are not observed during graph construction, and by Tversky, Kugelmass and Winter (1991), who found that even pre-literate children tend to organise quantitative information along these axes.
The first of the new diagrams introduced in this experiment shows predicted performance of stocks over several years in the market. The diagram is laid out in a conventional tabular form, with the time axis running from left to right, as shown in Figure 6.10. Each row of the table is a time line showing predicted performance of a particular stock in future years. The symbols that can be placed along the timeline show whether the stock is expected to rise or fall, to oscillate or become unstable, and whether it is cyclical around a stable price or climbing overall.
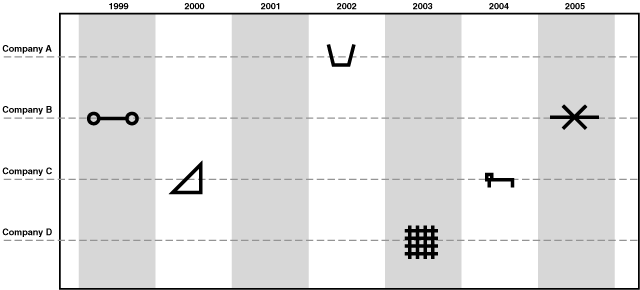
Figure 6.10. Stock market diagram.
E.g. the stock of company D is expected to climb in 2003
As in experiment 8, these symbols can be explained in terms of a systematic metaphor, where some resemblance is described between the symbol that is used and an element of the metaphor source domain. In this experiment, however, that resemblance is made far more apparent by replacing the stylised symbol with a small photograph of the actual source metaphor element. The corresponding photographs used in place of each symbol for the stock market diagram are shown in Figure 6.11. The systematic metaphor in this case is the range of motions made by playground equipment.
A seesaw represents a stock that is simply oscillating without rising. A slide represents a falling stock, and a swing is used for a stock that is oscillating, but rising higher each time. An unstable stock is represented by a rocking horse, a rising stock by a climbing frame, and a cyclical one by a roundabout.
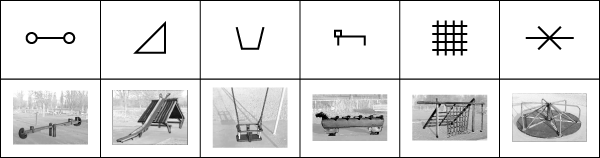
Figure 6.11. Stock market playground metaphor
Figure 6.12 shows the same stock market diagram as in Figure 6.10, but with the stylised symbols replaced by photographic icons.
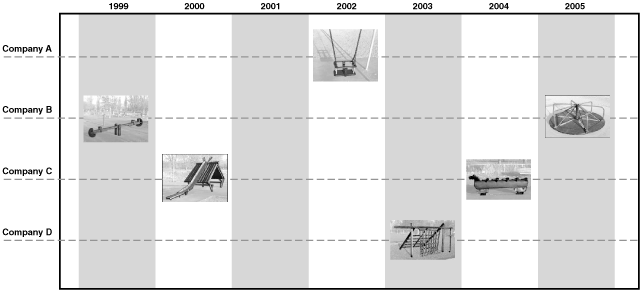
Figure 6.12. Stock market diagram with metaphorical photographs
The second new diagram expressed constraints in the layout of a newspaper front page; an example is shown in Figure 6.13. As in the previous diagram, constraints are represented by six different symbols that can be placed anywhere on the page layout. These symbols indicate attributes of the stories that should be placed in different locations: the main story of the day, an attractive photograph, an analysis story, a dull story, or stories that should be placed at the top of the page or in small gaps.
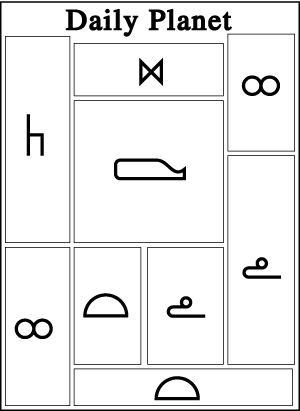
Figure 6.13. Newspaper layout diagram
The metaphorical presentation of the newspaper layout symbols is shown in Figure 6.14. The systematic basis of the metaphor comes from the attributes assigned by convention to different animals. A dull story is represented by a tortoise, a story at the top of the page by a giraffe, a story for filling small gaps by a mouse, an analysis story by an owl, a large main story by a whale, and an attractive photograph by a butterfly. As drawings of animals are more easily obtained than photographs, I used realistic line drawings in the pictorial version of the diagram.
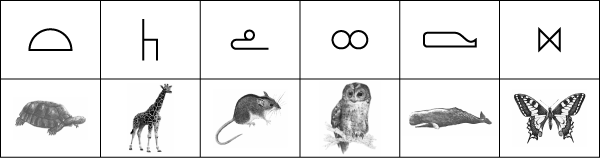
Figure 6.14. Newspaper layout animal metaphor
I also prepared pictorial versions of the two diagrams that were introduced in experiment 8. For the aeroplane landing diagram I used photographs of appropriate car controls, treated in the same way as has been described for playground equipment. For the gold mine diagram I used photographs of cutlery, taken against a white background. These two sets of photographs are shown alongside the corresponding stylised symbols in Figures 6.15 and 6.16.
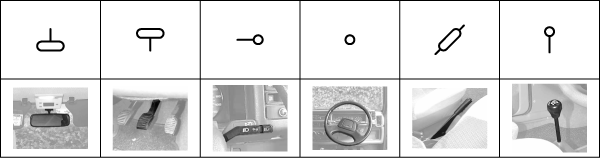
Figure 6.15. Aeroplane landing symbols and car controls metaphor
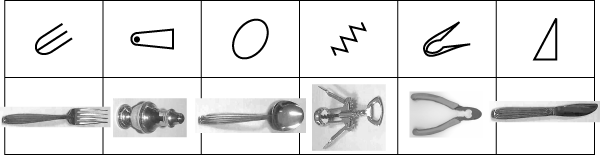
Figure 6.16. Gold mine symbols and cutlery metaphor
Participants completed two tasks using each diagram. The first was a comprehension task similar to that used in experiments 2 and 7. In the stock market task, participants identified stocks to buy according to certain criteria. In the gold mine task, participants identified which shaft in the mine would involve the greatest total effort or profit. The tasks used for the aeroplane landing and newspaper layout diagrams involved finding inconsistencies in a complete diagram, when assessed according to a supplied set of constraints. These tasks are reproduced in appendix B.9.
The second task was the recall task previously used in experiment 8, in which all six symbols that had been used in each diagram were presented out of context, and participants wrote definitions of each symbol.
Diagram completion tasks were not included in this experiment because it was not practical for participants to complete diagrams by drawing the photographic symbols.
As in experiments 2, 7 and 8, material was presented to participants in booklet form. Participants wrote directly in the booklet, and used a stopwatch to record the amount of time they spent working on each page.
The photographic versions of the diagram symbols were prepared by taking photographs of playground equipment, car controls and cutlery with a digital camera. I then used Adobe Photoshop software to mask the structural aspects of the scene that were relevant to the metaphor, and reduced the contrast of the background. The photographs then cropped to emphasise the metaphorical features, and reduced to cover an area of approximately 3 or 4 cm2 at a resolution of 200 dpi. The animal drawings were scanned from stimuli used in another experiment at the APU, and reduced to the same size and resolution.
Twenty four participants were recruited from the APU panel of volunteers. There were no factors varied between subjects, and three independent variables within subjects. The first independent variable had two levels: the metaphor was either explicitly present in the verbal explanation of the diagram, or absent. The second independent variable was the form of symbols used as elements in the diagram: these were either pictorial or stylised. These two independent variables were balanced in a latin square design, but as in previous experiments there was a partial confound with the actual diagram. As before, this partial confound was balanced across all participants. Performance was again tested using two different tasks: the comprehension and recall tasks described above.
There were three dependent variables: the time taken to read the diagram explanation, speed in the comprehension and recall tasks, and normalised accuracy scores for comprehension and recall tasks. The first hypothesis was tested in terms of speed and accuracy, the second in terms of accuracy in the recall task, and the third in terms of reading time.
Participants followed the same time-keeping procedure as in previous experiments, recording the time when they started working on each page. All four diagrams were presented at the start of the booklet, with explicit metaphor either present or absent from the explanations as appropriate. The presentation order of the different diagrams was the same for every participant: this meant that the presentation order of the different metaphor conditions was appropriately balanced.
The presentation of the diagrams was followed either by four pages with a comprehension test for each diagram, or by four pages with a recall test for each diagram. The comprehension test in this experiment involved finding inconsistencies in a complete diagram, when assessed according to a supplied set of constraints. This style of test was used rather than the diagram completion tasks of experiment 8 because it was impractical to ask participants to complete diagrams by drawing photographic symbols. The tests for each diagram were presented in the same order as the diagrams had been explained, but the order of the two blocks of tests, comprehension and recall, was balanced across participants. As in experiment 8, a debrief questionnaire at the end of the booklet asked participants to report what technique they had used to remember each set of symbols.
Completed booklets were scored by comparison to ideal worked solutions, and marking was done while blind to the metaphor condition with which diagrams had been explained. The straightforward memory task, in which participants wrote the definition of a symbol, was scored using the same procedure as described in experiment 8. The comprehension tasks were scored by subtracting one mark for every problem constraint that was violated in the solution. Where no response was made to some parts of a question, further marks were subtracted. These were allocated so that each solution started with a possible ten marks, which were reduced to zero if no answer was given. A large number of constraint violations could result in a score below zero, however.
The first hypothesis was that neither the form of the symbols nor the provision of a verbal metaphor would improve problem solving performance. Both problem solving scores and recall scores are shown in figure 6.17. Problem solving performance in tasks with an explicit verbal metaphor supplied actually tended to be poorer than for those without the verbal metaphor, although this difference was not statistically significant, F(1,23)=0.84, p=.368. There was, however, a significant improvement in performance as a result of the implicit pictorial metaphor, F(1,23)=4.49, p<.05.
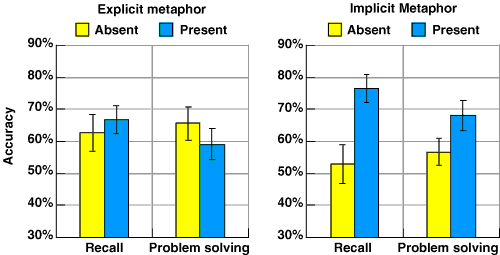
Figure 6.17. Problem solving and recall scores with implicit and explicit metaphors
The mean times taken to complete the recall and problem-solving tasks were approximately 10% slower in cases where an explicit metaphor had been provided, although this was not statistically significant for either recall or problem solving, F(1,23)=3.49, p=.121 and F(1,23)=2.59, p=.074 respectively.
The second hypothesis was that the pictorial symbols of the implicit metaphor would selectively improve recall performance. This was the largest effect observed in the experiment, F(1,23)=26.09, p<.001. Unlike the problem solving scores, inclusion of explicit metaphor did produce a slight trend toward improving the recall score, but the effect of explicit metaphor is not significant, F(1,23)=0.90, p=.353.
The third hypothesis was that reading time would be shorter when pictorial symbols are used rather than abstract ones. This was the case, as shown in figure 6.18, F(1,23)=5.51, p<.05. The difference was larger than the difference in length of the text resulting from presence of an explicit metaphor. The effect of pictorial symbols on reading time also tended to be larger when no explicit metaphor was included in the explanation, although the interaction was not significant, F(1,23)=1.14, p=.297. This supports the conclusion made in experiment 7, that users of diagrams can generate mnemonic metaphors relatively quickly compared to the time that it takes to understand a metaphor provided with the diagram explanation.
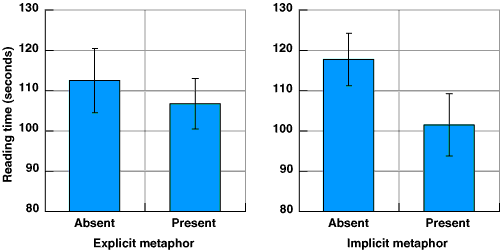
Figure 6.18. Variation in reading time with implicit and explicit metaphors
The presentation of results for experiment 8 included a simple count of the number of occasions on which participants described a mnemonic technique involving their own metaphorical system. In this experiment, each of the 24 participants received instructions without a metaphor for one diagram with pictorial symbols, and for one diagram with geometric symbols. Of the 24 pictorial cases, 20 participants reported the creation of a metaphor based on the pictures. Of the 24 geometric cases, only 9 participants reported the creation of a metaphor. As in experiment 8, the metaphors developed for geometric symbols were often imaginative. The grid that represented a climbing frame for rising share prices was remembered by one participant as a "prison gate to lock in profits" and by another as "a grate time to buy". The non-metaphorical strategies that were reported included non-specific verbal strategies ("associate a word with each symbol") and sequential strategies ("tried to remember them in order"). Of the four pictorial cases where a metaphor was not reported, one participant reported a verbal strategy ("talked myself through them"), one a spatial strategy ("tried to remember positions on the page"), one indeterminate ("by association") and one simple failure ("I didn't construct a method").
I also tested for any effect of varying the order of problem solving and recall tasks, to determine whether the presentation of problem solving tasks before recall tasks in experiment 8 may have improved recall performance as a result of rehearsal effects unrelated to the metaphor treatment. There was no significant difference between any of the four independent variables in cases where recall was tested before and after problem solving: t-tests of order effects on scores for problem solving and recall respectively were t(22)=0.220, p=.82 t(22)=0.501, p=.62, while t-tests on the times taken to complete these tasks were also non-significant: t(22)=0.762, p=.45 and t(22)=0.923, p=.36 respectively.
The results of this experiment confirm the hypotheses regarding the relative benefits of implicit pictorial metaphor and explicit explanatory metaphor. Metaphor in diagrams is mainly a mnemonic aid rather than a structural aid to interpretation of the diagram. Furthermore, this mnemonic aid is more pronounced where the pictorial content allows users to generate their own metaphors, rather than when an explicit instructional metaphor is provided.
The mnemonic advantage of pictorial material is predicted by several theoretical models. Paivio's dual coding model predicts that associating any concrete image with the presentation of verbal information will improve recall (Paivio 1971,1983). Marschark and Hunt (1985) have demonstrated that a high rating of imageability of a verbal metaphor is a good predictor for later free recall of that metaphor. Glenberg and Langston (1992) explain the value of illustrations accompanying text as resulting from the formation of a richer mental model, where the additional information in the illustration facilitates the noticing of many relationships that might only be implicit in the text (although Langston, Kramer & Glenberg (1998) have recently reconsidered the assumption that noticing results from mental image representations - it seems that implicit spatial relationships in simple verbal descriptions are seldom noticed). In any case, mental models constructed as self-generated metaphors are likely to be richer than those formed while interpreting texts.
The effect on performance of changing the degree of pictorial detail, and hence varying the amount of information provided in pictures, has been investigated before. The work of D. Schwartz (1995) was reported in chapter 4 - he found that lower fidelity representations were more likely to be analysed symbolically rather than by mental animation strategies. Goolkasian (1996) reports that comparative judgements made from simple geometric stimuli are faster than those made from verbal stimuli, whereas Potter et. al. (1986), as discussed in experiment 8, find that pictorial stimuli take longer to process than words. Nelson, Metzler and Reed (1974) compared recognition performance for words, line drawings and photographs. They found an advantage of pictures over words, but no further advantage from increasing pictorial detail (although their black and white photographs were relatively poor compared to modern experimental stimuli). Ryan and C.ĘSchwartz (1956) found that caricatures were interpreted faster than either line drawings or photographs - this seems unsurprising, as the caricatures made salient features more prominent. These rather mixed results do not provide a firm foundation for generalisation to either diagrams or to HCI. Strothotte and Strothotte (1997) note that, although graphical symbols in a user interface must ultimately be interpreted by convention, the benefits of representational detail are disputed. They quote Dale (1969) as recommending realism for educational purposes, while Travers (1964, cited by Strothotte & Strothotte) criticises this practice as the "worship of a false god".
An interesting investigation of pictorial detail in user interface icons that does support the findings of this experiment is reported by A.ĘGreen and Barnard (1990). They observed the time that users took to select a specific icon from an array of distractors. The icons in the array were either abstract symbols or representational pictures. They found that search times for the representational pictures were initially slower than for abstract symbols, but that improvement with practice was significantly greater for representational pictures. Rohr (1987) has also investigated two alternative models of pictorial information in user interfaces. The first is derived from Jackendoff's theory of conceptual semantics (1983), in which the structural categories of the physical world are applied systematically to the interface representation. The second is derived from Paivio's dual coding theory (1971), in which images provide mnemonic codes. Rohr found that experimental participants could be divided into two groups: visualisers were more likely to improve their recall using pictures as a result of dual coding; formalisers were more likely to apply structural categories to the user interface, but they did this using verbal strategies rather than visual strategies.
These two studies support the results found in this experiment - Green and Barnard report that representational detail supports learning, and Rohr reports that pictorial icons are more likely to be used to assist recall than they are to support systematic metaphors. They are relatively unusual amongst previous studies of user interface metaphor, however. Most previous research has emphasised the benefits of systematic metaphor in designing graphical or diagrammatic user interfaces. The results found here suggest that simple mnemonic effects are far more significant.
Continue reading chapter 7 , or return to table of contents and download information .