This is a joint post with Frank McSherry, cross-blogged at CamSaS and his blog.
In the first part of this series, we have shown that some computations see large speedups when running on a faster network, illustrated by a PageRank implementation in timely dataflow in Rust. This seemed to run counter to the findings in a recent NSDI paper that many "big data" computations can only gain a 2-10% speedup from a faster network: although we found this to be true for the Spark/GraphX stack investigated in the paper, it did not generalize to timely dataflow.
We are going to try to explain a bit more about why it doesn't generalize: how are the systems different, and what should we learn?
We also profile both systems to explain the differences that we observe, address some of our readers' questions from part one, and show some further improvements we have since made.
Finally, we return to our initial question of whether having a 10G network is beneficial. We compare process-level aggregation and worker-level aggregation at 10G: with a fast network, reducing computation and increasing communication actually helps. However, maybe a faster aggregation strategy could bring 1G to performance parity with 10G? It turns out it cannot. We show that even if aggregation was infinitely fast, the amount of aggregated data is still sufficiently large that sending it at 1G line rate would take longer than it takes for our 10G worker-level aggregation implementation to complete an entire PageRank iteration.
tl;dr #1: GraphX spends significantly more time computing and stalled on memory accesses than it could possibly spend using the network. Timely dataflow, by comparison, let us write PageRank as a "balanced system", bottlenecked evenly on each of its resources.
tl;dr #2: worker-level aggregation on a 10G network is 10-20% faster than the more aggressive process-level aggregation, even though it sends significantly more data.
tl;dr #3: a lower-bound analysis shows that even the best possible 1G implementation of process-level aggregation will be at least 2-3x slower than our 10G implementation.
Bonus: timely dataflow improved since we published part one, bringing the PageRank per-iteration times down to about 0.5s (from 0.7s). The PageRank code didn't need to change to benefit. We have some of the improved numbers in paretheses, but unless otherwise mentioned the data are from the weeks-older version.
Performance comparison
To better understand the difference between timely dataflow and GraphX, we collected some utilization data from the cluster machines while running our computations. The time lines presented in the following were recorded using the collectl utility, with samples taken every 100ms on each machine.
GraphX
Lets look at a trace of GraphX on one machine over its execution on the uk_2007_05 graph. Different machines' time lines can differ significantly with GraphX, so we also supply the graphs for all machines.
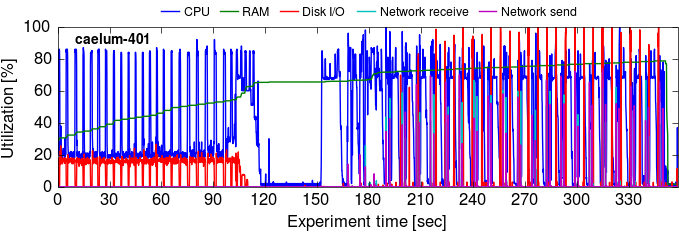
This is a bit hard to read; let's zoom in to the GraphX plot a bit. We pick a 30 second range in the iteration phase (210-240s; graphs for all machines):
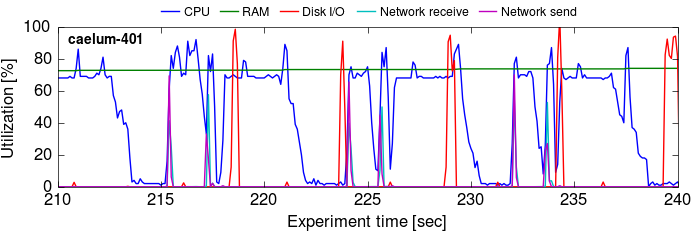
That's a bit more readable; there are three distinct iterations clearly visible here.
The plots tell us a bit about where GraphX's time goes:
There is some idle time during each iteration, where the Spark workers wait on a few slower (or more burdened) machines (e.g. caelum-302). It's also evident from the gradual drop in CPU utilization that some tasks on each machine take longer than others. This corroborates results from the NSDI paper, that Java GC can be a cause of stragglers (§5.3).
GraphX uses the disk, but not very much. In the initial phase (before iteration 1 completes), the disk I/O is composed of local reads of the input data set (each of 23 read bursts reads 1.5 GB of data). Although each worker's data are held in memory,0 in each iteration GraphX has two write bursts to the root filesystem SSD,1 which (as we understand it) is a consequence of Spark writing all shuffled data to disk (see §3.2 in the NSDI paper).
GraphX's memory usage is truly epic. The graph's input edge list in ASCII is 63 total GB on disk2 and 15 GB in binary, which when partitioned should amount to less than one GB per machine across 16 machines.3 GraphX uses substantially more memory than this: its memory footprint grows to 42 GB in the load phase, and further to 50 GB during the iterations. This is possibly due to the overheads of tracking many small Java objects (a known issue, being addressed in Spark 1.5). As a result, GraphX doesn't run on the uk_2007_05 graph with fewer than eight of our 64 GB machines, and it doesn't run on the twitter_rv graph with fewer than 16 machines, as our results in part one have shown.4
There is some brief network traffic in each iteration, with two spikes that send and receive between 1 and 1.5 GB together. The spikes occur early in the iteration, once at the start of the first period of intense CPU use, and then again at the beginning of the second one. The computation appears to rarely be blocked on them (as observed in the NSDI paper).
Most of the time is spent with the allocated CPUs (8 out of 12) fully saturated, corroborating the NSDI paper's finding that Spark/GraphX are mostly CPU-bound. It isn't entirely clear to us what the GraphX computation is exactly doing with all this compute, although serialization overheads are proposed in the NSDI paper. Our later profiling results indicate that serialization is about 20% of the time, and that in addition to compute GraphX may be waiting on memory for a large fraction of time.
Now, let's look at the timely dataflow implementation for comparison!
Timely dataflow
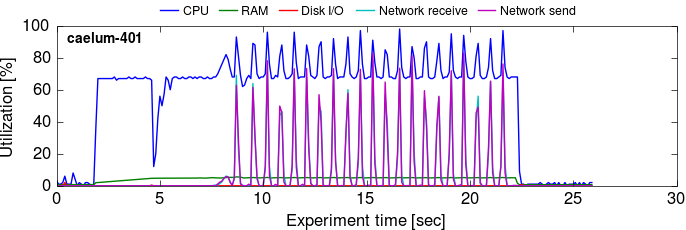
Here is the timely dataflow trace from one machine (it is fairly representative of all 16 timely dataflow traces) across its execution on the uk_2007_05 graph:
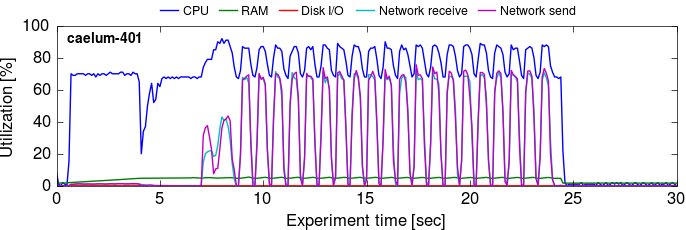
Notice the timescale: in 20s – the time it takes GraphX to do two iterations above – our timely dataflow implementation has started and completed the entire computation, including loading, partitioning, and sorting the edge data and running 20 iterations.5
The compute is much leaner here, there is very little skew (despite no cleverness in partitioning the graph, something that many papers claim is critical!), and memory utilization is just a few gigabytes (the line is hard to see as it remains below 2 GB, under 4% of the machine's total 64 GB RAM).
What is timely dataflow doing differently? Well, the short version is that there isn't really all that much to do, and timely dataflow doesn't do much more than that.
Let's go through the moving parts and see what has to get done.
Initially: loading up data
The computation first needs to load up and exchange the edge data, so that each worker has the edges associated with the vertices it is responsible for. There is little disk I/O in this phase as we have a hot buffer cache. Each worker then "exchanges" and sorts the edges, and gets ready to start computing.
We put "exchanges" in quotes because each worker only loads the edges it will eventually require (and the whole dataset is on the machine already), so although they go through timely's exchange channels, none actually reach the network in practice. If we were to send them, the 3.7B edges would require 29.7 GB on the wire, i.e., 1.86 GB on each of the 16 computers. This would take about 1.5s to exchange on a 10G link, or 15s on a 1G link.
As the number of processes grows, the number of edges each process must exchange and sort decreases. For 1.4 billion and 3.7 billion edges, each of 16x8 = 128 workers must process roughly 11 million (twitter_rv) and 29 million edges (uk_2007_05). Exchanging and sorting these data takes each worker just a few seconds (we use a radix sort), and it could be even faster with more effort.
Each iteration: producing, sending, and receiving updates
Once each worker receives the signal that there are no more edges due to arrive (a "notification" in Naiad terms), it is able to start producing rank updates for each of its edge destinations. This involves first preparing the src vector, by dividing each entry by its degree, scaling down by alpha, etc.; this is all just a linear scan through a vector, doing a few operations on each element.
Producing updates
The worker then walks sequentially through the list of edges, ordered by destination, and for each edge performs one random access into the src vector. These vectors are relatively compact, and get smaller proportional to the number of workers involved, hence improving locality with scale. For 61M (twitter_rv) and 105M (uk_2007_05) vertices, each worker indexes into roughly 476,000 and 820,000 elements, respectively. These aren't huge sets, but they don't all fit in the CPU caches. Waiting on reads from memory is one of the places that our implementation spends its time (as does GraphX, as we'll see).
Sending updates
For each destination, the worker must also send a (u32, f32) pair, indicating a rank update for the relevant vertex. These are handed to the timely dataflow system, which maintains buffers for each destination. Once sufficiently many updates are at hand (or the worker finishes), the data are serialized: this is essentially a memcpy, as it is in many other languages that are not JVM-based (e.g., C, C++, C#), which may explain some of Spark and GraphX's overhead. Serialized data are then put on the network by a separate thread for each socket, without blocking the worker.6
Receiving updates
Having sent all of the necessary updates, a worker repeatedly receives updates from other workers. Each worker removes binary data from a queue shared with the networking threads, who each demultiplex data received from the network into said queue. Each worker thread deserializes the data (again, a memcpy), and the applies the += operation indicated by the update to its src vector. Although the data could be arriving in any order, destinations are ordered small to large, and we might hope for good locality here.
Recap
A distributed PageRank implementation doesn't need to do much more than read and accumulate values for each destination, memcpy the results a few times, and apply the updates. Timely dataflow doesn't really do much more than help out with this, managing the partitioning of the updates (more on this in a bit), putting bits on the wire, and coordinating the workers (telling them once they've received all the messages for an iteration).
In a perfect world, timely dataflow computations are either running user code as written, or waiting on data from the network. If you get the "user code" part sorted out properly, communication is really the only thing left to improve.
GraphX is integrated with a larger data processing stack, and expresses graph computations by iteratively repeating higher-level dataflow operations ("join" and "group by" stages, forming a triplets view; §3.2 in the paper) and the graph as a set of parallel collections (§3.1). This approach requires a number of auxiliary data structures and makes additional passes over the data, with several optimizations aiming to reduce communication (§4.1-4.4). This, and implementation-level overheads owed to the JVM's data representation, is a likely explanation for the memory and computation overhead it sees over timely dataflow.
Profiling
After that detour into how the implementations work on a conceptual level, let's answer some more questions about the differences between GraphX and our implementation with the aid of some profiling.
One reasonable question to ask is where the time goes in GraphX, and what could be done to reduce this overhead. To find out, we attached the JvmTop profiler to the running GraphX version of PageRank. The following snapshot is fairly representative for what we saw during the compute phase:
JvmTop 0.8.0 alpha - 09:16:33,  amd64, 12 cpus, Linux 3.13.0-24, load avg 4.59
 http://code.google.com/p/jvmtop

 Profiling PID 15963: org.apache.spark.executor.CoarseGrainedE

  57.15% (    13.14s) scala.collection.Iterator$$anon$13.hasNext()
  11.07% (     2.55s) scala.collection.Iterator$class.foreach()
   3.65% (     0.84s) ....esotericsoftware.kryo.serializers.FieldSerializer.ne()
   2.97% (     0.68s) org.xerial.snappy.SnappyNative.arrayCopy()
   2.80% (     0.64s) scala.collection.Iterator$$anon$11.next()
   2.59% (     0.59s) io.netty.channel.nio.NioEventLoop.select()
   2.38% (     0.55s) org.xerial.snappy.SnappyNative.rawCompress()
   2.18% (     0.50s) com.esotericsoftware.kryo.Kryo.readClassAndObject()
   1.82% (     0.42s) ....esotericsoftware.kryo.serializers.FieldSerializer.re()
   1.25% (     0.29s) ....esotericsoftware.kryo.util.DefaultClassResolver.read()
   0.95% (     0.22s) com.twitter.chill.KryoBase$$anonfun$1.apply()
   0.81% (     0.19s) org.xerial.snappy.SnappyNative.rawUncompress()
   0.80% (     0.18s) com.twitter.chill.ScalaCollectionsRegistrar.apply()
   0.78% (     0.18s) ....esotericsoftware.kryo.util.DefaultClassResolver.writ()
   0.74% (     0.17s) ....esotericsoftware.kryo.serializers.DefaultSerializers()
   0.73% (     0.17s) com.esotericsoftware.kryo.Kryo.newSerializer()
   0.66% (     0.15s) scala.collection.IndexedSeqOptimized$class.foreach()
   0.57% (     0.13s) ....esotericsoftware.reflectasm.AccessClassLoader.loadCl()
   0.46% (     0.11s) scala.collection.Iterator$$anon$11.hasNext()
   0.40% (     0.09s) scala.collection.immutable.Range.foreach$mVc$sp()
Serialization overhead has been suspected as the main culprit, and is certainly responsible for some of the overhead. If, as a crude approximation, we sum everything with kryo and xerial in the name above, we get 19.63% of time being devoted to serialization. (Note that garbage collection, another important factor in Spark performance, does not show up here, as JvmTop only profiles when the JVM runs user code.)
However, a much larger fraction of time (72.54%) is spent in various Scala collection methods, with 57% of time in the hasNext() method of some iterator. This may be user logic (GAS vertex implementations), or edge iterators – who really knows?7
Additionally, one of our readers suggested taking average cycle-per-instruction (CPI) measurements for GraphX and timely dataflow in order to see which system spends more time waiting on memory. We thought that was a rather nice idea, so we went and did it using the perf profiling tool for Linux.
| Metric | GraphX, 10G | Timely dataflow, 10G |
|---|---|---|
| Cycles per instruction (CPI) | 1.95 | 1.09 |
| Stalled cycles per instruction | 1.54 | 0.74 |
| Instructions per LLC miss | 252 | 522 |
The table shows what we already suspected: GraphX's CPI is almost 2x higher than timely dataflow's, meaning that the processor spends more time waiting on other parts of the system than actually doing work. Likewise, GraphX has a higher average number of stalled cycles per instruction, and misses in the LLC more often (about every 252 instructions vs. every 522 instructions in timely dataflow).
In essence, these numbers tell us something that the CPU timeline above did not: both timely dataflow and GraphX are memory-bound on this computation (as we expected), but timely dataflow has better cache affinity and thus (potentially) spends less time waiting on memory accesses.
Good news everyone! Timely dataflow has got even faster.
Since we reported the results in part 1 of this series, timely dataflow has improved. Primarily, this has been about streamlining data movement, cutting out several redundant memory copies and simplifying the exchange channel logic, resulting in higher network utilization.
Here are the utilization time lines before and after the improvements:

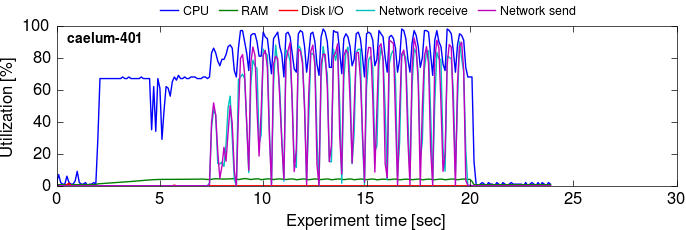
The second series is effectively just a compressed version of the first: the network and compute utilizations spike higher as we need less time to process the same amount of data.
Numerically, the total and per-iteration times for 16 workers improved to 14.5s (from 19.3s) and 0.53s (from 0.75s) on the twitter_rv graph, and 19.1s (from 23.7s) and 0.59s (from 0.76s) on the uk_2007_05 graph. The per-iteration times improved by 1.37x and 1.28x for the two graphs (≈30%), which bump our best-case improvement over GraphX from 17x to 23x.
We are pointing this out because we had to get some measurements we hadn't made, and needed to re-calibrate for them. Specifically, ...
Process-level vs. worker-level aggregation on 10G
As one astute reader observed, while we pointed out that worker-level aggregation outperforms process-level aggregation on a 10G network, we did not report the detailed numbers in part one.
For bonus credit, we got utilization time lines for process-level and worker-level aggregation on 10G to visually present the trade-offs involved. These measurements are on the improved timely dataflow code.

The process-level aggregation experiment shown in the time series shown here uses the network noticeably less than the worker-level time series does, but also takes longer because it keeps the workers busy for a bit longer on each iteration (due to the extra aggregation work). As you may remember from the first part, the worker-level aggregation strategy allows us to start sending updates as we produce them, while process-level aggregation must wait until all updates are produced.
When we applied our trusted perf profiler, we found that both aggregation strategies consume about the same number of cycles, but the worker-level aggregation spends these cycles managing the additional network data on separate cores, rather than occupying the worker threads with additional aggregation. Moreover, we found that worker-level aggregation hits the last-level cache twice as often (probably due to the network threads accessing a larger working set), but it has a lower LLC miss ratio (39.6% vs. 47.1% for process-level aggregation). Finally, worker-level aggregation has a higher CPI (1.18) than process-level aggregation (0.99) – again, likely because of its larger working set.
All in all, worker-level aggregation is 10-20% faster than process-level aggregation on the 10G network, but up to 4x slower on 1G (as discussed in part one). This comes despite sending more data over the network – sometimes, being more chatty actually helps!
Lower bound analysis
That process-level aggregation stuff sure seems to transmit a lot less data. Maybe if only we had worked harder to optimize the CPU use we would see a 1G network overtake the worker-level 10G implementation. Could a better implementation get closer to the 10G performance with more engineering? Yes, but not too much closer.
Let's reason about how fast the best possible 1G implementation could go. Due to the way we have arranged the computation, each machine must communicate at least some number of updates. Using worker-level aggregation, each process must transmit a number of updates equal to the sum of the numbers of distinct destinations for each worker. Using process-level aggregation, by contrast, each process must transmit a number of updates equal to the number of distinct destinations across all of its workers.
This does reduce the number of required updates, but it only reduces it so much.
Each process must transmit at least this smaller number of updates. The time it takes to put this data onto a 1G network is the lower limit on how fast it can go, even if the aggregation takes no time at all. If this lower limit ends up taking longer to send the data than a 10G implementation (spoiler: it will), we have learned something.
Let's look at the minimum number of updates that one specific process8 must transmit when using process-level aggregation. Each update is at least 8 bytes (a u32 and a f32); divided by 1 Gb/s, we get a lower bound on how quickly this approach can iterate on a 1G network (assuming infinitely fast aggregation). Depending on the number of machines, this time is between 1 and 5 seconds (third column). This best-case bound is still often slower than our measured, real-world 10G times. If we compare the two, we get a lower bound on the speed-up from using our 10G implementation as compared to the most efficient 1G implementation possible (fourth column).9
| cores | updates | 1G lower bound | 1G bound / 10G measured |
|---|---|---|---|
| 2x8 | 31,215,505 | 2.00s | 0.85x |
| 4x8 | 26,835,975 | 1.72s | 1.15x |
| 8x8 | 22,809,014 | 1.46s | 1.39x |
| 16x8 | 15,836,150 | 1.01s | 1.35x |
| cores | updates | 1G lower bound | 1G bound / 10G measured |
|---|---|---|---|
| 2x8 | 75,220,268 | 4.81s | 2.08x |
| 4x8 | 55,465,829 | 3.55s | 2.30x |
| 8x8 | 39,443,730 | 2.52s | 2.36x |
| 16x8 | 26,866,965 | 1.72s | 2.26x |
These numbers indicate that one cannot hope to get the observed 10G performance on a 1G network just by optimizing the computation. Of course, there are other options – such as laying out the graph data along the "smarter" Hilbert-curve mentioned earlier – which we leave for another post.
How "close to the metal" are we?
With graph processing systems, hardly a systems conference seems to go by without another paper announcing manifold speedups over some precursor system. How much more room is there for improvement in our code?
First, we could change the program to look more like the smarter single-threaded code, which uses a Hilbert space-filling curve to lay out the edge data. This can improve cache locality and reduce time blocked on memory reads, and can also reduce the data transmitted across the network. That would be a great thing to try out, and we will probably do that, but let's look at some anecdotal evidence of how "close to the metal" what we already are.
Perhaps surprisingly, one of the more expensive parts of our implementation is the division by workers, which each worker needs to do for each received (y, update) pair:
// repeatedly receive data from other workers
while let Some((iter, data)) = input2.pull() {
    notificator.notify_at(&iter);
    for x in data.drain_temp() {
        src[x.0 as usize / workers] += x.1;
    }
}
If we hard-wire workers to a compile-time constant power of two (specifically, 16x8 = 128), the per-iteration runtime drops by about 10%, as the compiler turns the division into a shift.
The fact that replacing arbitrary divisions with constant shifts yields such speedups likely suggests that we're getting pretty "close to the metal", and that relatively few other system overheads exist in our implementation.
Caveats & discussion
This blog post would not be complete without some discussion of the caveats of what we've discussed – be they perceived or real. Here are some objections to our analysis that you might have.
Your approach seems to require a lot of hand-coding and tuning; is it user-friendly?
If you look at our code one thing becomes clear: the implementation indeed looks more like a "program" than implementations for other data processing systems might. Timely dataflow mandates relatively little program structure (compared to, say, MapReduce's or Spark's paradigms), which gives us the flexibility to write the program as we see fit.
This flexibility is helpful, but it comes with greater responsibility. While a programmer can more easily write performant code in timely dataflow, she can also more easily stumble into anti-patterns. GraphX's higher-level interfaces may be the better option for writing the simplest possible programs; however, timely dataflow still maintains the core benefit of MapReduce, Spark and other parallel programming frameworks: it alleviates the user of having to implement tricky distributed coordination code, and the computational core of a PageRank implementation is pretty concise.
One could certainly write a "library" of PageRank and other graph computations atop timely dataflow, providing an appealingly simple interface to the more casual user. Timely dataflow allows the inter-operation of pre-fabricated parts (similar to Naiad vertices) with hand-rolled operators as appropriate for the computation.
Doesn't the lack of fault tolerance mean that you avoid overhead?
One major difference between timely dataflow and Spark/GraphX is that the latter can tolerate worker failures.10 Fault-tolerance absolutely introduces overheads, both directly and indirectly: GraphX writes data to disk, but also needs to be structured as a stateless dataflow which prevents (or at least complicates) the maintenance of indexed in-memory state, while timely dataflow is stateful.
A different question is whether fault-tolerance is serving its purpose here. In batch processing, fault-tolerance is fundamentally a performance optimization, meant to get you the result faster than re-running the computation from scratch. Arguably, this investment makes sense when dealing with jobs over many hours and hundreds of machines, but if the entire computation takes on the order of 20s over a handful of machines, it may not be worth it. Of course, this trade-off may chance for larger graphs and more PageRank iterations.
That said, timely dataflow could be extended with support for fault tolerance. A blunt approach would simply check-point intermediate results (e.g., every 100 iterations). There is also some existing work on cleverer fault-tolerant abstractions of Naiad's version of the timely dataflow model, and this could be applied to our implementation.
GraphX is part of a general-purpose stack, not a special-purpose graph processing system; isn't this is a flawed comparison?
We weren't specifically trying to do a bake-off between Spark/GraphX and our code, though the observed results are a happy coincidence. Rather, we were trying to understand what is it about systems that prevent them from benefiting from modern networking kit.
Spark and timely dataflow are both general-purpose data-parallel systems, and you can build graph processing infrastructure on either (GraphX and Naiad's GraphLINQ, respectively). However, their relative performance reveals a bit about the properties of the underlying systems. In this work, we wrote code that fills GraphLINQ's role atop timely dataflow in Rust (although we didn't implement everything GraphLINQ supports).
What about other state-of-the-art systems; are you as fast as GraphLab or Naiad?
Performance-wise, the closest competitor (and to our knowledge, the previous-best system) is Naiad, which is based on the same timely dataflow paradigm as the code presented here. Naiad runs one iteration of PageRank on the twitter_rv graph in ≈2s using 16 dedicated eight-core machines, and in ≈1s using 49 machines (Fig. 7(a), §6.1 in the paper).
The Naiad numbers are on a 1G network, and were totally communication bound: there was about 0.15s of computation each iteration, and the rest waiting on communication. Naiad would likely see substantial improvement from a 10G network, too. We have established above that our implementation shown here cannot beat 1s on a 1G network without fundamentally changing the algorithm (Naiad used a Hilbert space-filling curve to partition the edges); on a 10G network, our best result for the same computation is 0.5s per iteration using 16 machines.
The GraphX paper authors found its performance equal to GraphLab and Giraph; our results also beat the published numbers from these systems, though we haven't done a deep-dive comparison against them. Our understanding is that the GraphLab numbers have improved substantially from their published paper.
The NSDI paper isn't about PageRank; how does your analysis apply to their conclusions?
The NSDI paper made some specific observations, and suggested that they may generalize. Our point is that they do not generalize too much, and that the outcome depends on the workload, the data processing system implementation and the available hardware.
The majority of the workloads in the NSDI paper are TPC-DS and BDBench queries, whose Spark implementations shuffle less data than they read as input. This property is one of the reasons invoked to explain why improving the exchange performance does not improve overall performance.11
The NSDI paper's conclusions may generalize for other types of computations, but we won't know without implementing them as well.12 At least one other paper reports that for well-tuned implementations, the JOIN processing common in analytics workloads should be network bound, even on an Infiniband network.
Lessons learned
To finish up, let's recap what we've learned.
Computers are surprisingly fast!
Modern hardware can do quite a lot of work in a short time – for example, it can iterate over 3 billion edges and exchange hundreds of millions of updates in less than a second. However, to get this performance, it is necessarily to carefully think about how every layer of the system works. Our ability to speed up PageRank by up to 16x (or 23x, with the new numbers) suggests that there's still a fair bit of this kind of optimization to be had in distributed data processing systems.
Faster networks can help, and they influence implementations.
Strategies that are helpful on a (slow) 1G network, such as process-level aggregation, can actually be harmful on a faster 10G network. Spark and GraphX are examples of systems designed with the assumption that I/O is slow, and that doing extra computing to reduce the I/O required is always beneficial. As we've shown with the aggregation strategies, this is not necessarily the case. This motivates thinking about whether we need systems capable of dynamically adapting their strategies to the hardware they're running on.
Distributed processing does help even communication-heavy graph workloads.
Our best distributed PageRank is 11x faster than even the smart, Hilbert-curve-based single-threaded implementation (now 13.4x), and 5x faster than our best multi-threaded, single machine implementation. In other words, even communication-heavy workloads on data sets that fit into a single machine can get significant benefit from a distributed implementation, provided it makes good use of available system resources.
Balanced system design is key.
Our implementation overlaps communication and computation, stressing CPU and network resources roughly equally. In general, when adding to one resource failed to deliver speedups, we could realize them by improving on another: when we found that network utilization was uneven, we improved it by re-structuring the computation to overlap communication more, and when computation became a bottleneck, we reduced it by communicating more data. The goal should be a system in which improving any single resource won't yield a speedup on its own. Spark/GraphX, by comparison, looks highly CPU-bound, and needs some heavy optimization before becoming network-bound.
Timely dataflow is quite a neat paradigm.
A lot of our freedom to optimize things is owed to the flexibility of timely dataflow, which only mandates some very light progress tracking, and that workers respect the promise to send no more data for a timestamp after it has been "notified". Since this paradigm does not mandate many implementation choices, we are able to implement things such that all system resources are best utilized at all times.
While our timely dataflow implementation surely isn't the last word in graph processing, it really is pretty simple, it gets the job done, and it goes pretty fast. You could certainly improve many of the implementation choices we made, or do something totally new, different and better! It really isn't that hard to write this stuff, and we'd love to see more people doing inventive work rather than doing minor tweaks to existing monolithic stacks.
Maybe let's all agree that we can stop talking so much about numbers that are slower than those above, and focus our attention on how to build things that are better.
Posted on July 31, 2015 by Frank / @frankmcsherry and Malte / @ms705.
0 – GraphX's default "storage level" for the edge and vertex RDDs is MEMORY_ONLY (see here), and we use the default settings.
1 – This is because Spark by default uses /tmp for its local intermediate storage (the SPARK_LOCAL_DIRS environment variable); as recommended, this is located on the SSD in our setup. The input data set, however, is on a spinning disk, as the SSD is not large enough to hold it (hence the "low" utilization in the load phase).
2 – The ASCII edge list representation is actually a tremendously wasteful representation of the graph. For timely dataflow, we use a binary adjacency list representation that stores the same graph in 15 GB (4.2x more efficient). GraphX could, of course, use the same binary representation (but the GraphLoader class used by the canonical PageRank example assumes an ASCII edge list). This difference – and any one-off transformation into binary – only affects the one-off startup cost, however, and has no impact on the per-iteration runtime (as by then, the graph is stored as binary integers in memory).
3 – Our binary representation uses 32-bit unsigned values, which are sufficient for the graphs we study (just). Larger graphs require 64-bit values, but should still remain within ≈4 GB of working set per machine. Moreover, using 64-bit values potentially increases the amount of network traffic required, which would exacerbate our findings.
4 – It may be surprising that the smaller Twitter graph puts GraphX under more memory pressure. We suspect that this is due to its power-law nature, with some vertices having a very large number of edges.
5 – You might wonder why our load phase is much shorter, and why there's little disk activity: this is because we ran all of our experiments on a hot buffer cache (i.e., having run the computation before to warm it up). GraphX does not seem to benefit much from this, which may be because its large runtime memory consumption ends up evicting most of cached data before the computation completes. However, even paging the data from a cold buffer cache ends up taking only tens of seconds, since each worker only reads less than 1 GB.
6 – The network threads are the reason why we allocated only eight cores per machine to the compute workers; however, as the timeline shows, we actually still have some CPU headroom.
7 – The Rust version also uses an iterator to produce updates, but you don't see it in any traces because optimizing compilers.
8 – We show numbers from process 0 here, but the numbers for others are similar.
9 – We use our older, slower numbers to avoid re-running everything with the new code; the ratios would only improve with our newer numbers.
10 – Although when Spark workers failed due to running out of memory in our experiments, the PageRank computation did not seem to recover: it spun on the same execution stage for 30 minutes before we terminated the job.
11 – Incidentally, this property is true of the GraphX PageRank too for up to three iterations: for the uk_2007_05 graph, it reads 63 GB of ASCII text, and then shuffles 23.8 GB of data per iteration. This does, however, illustrate a potential pitfall with the use of "input bytes" as a metric: the same input data can be represented at very different levels of compactness, and may yet still result in the same runtime shuffle size. As we discussed in footnote 3, the input size can be reduced significantly by using a binary representation, without affecting the shuffle size.
12 – We implemented TPC-H query 17 in timely dataflow to show that it can be done, and it went quite fast when we tested it. However, we haven't done a detailed evaluation of it.
