

|
File Formats |
Sankey Diagrams in JouleSankey diagrams provide a way of visualising the size of components in complex flows (e.g. of energy, money, ...). They are named after the Irish naval officer, Sankey, who used them to investigate the efficiency of steam engines. They are used in Joule in a simplified way to show how the a flow of energy is distributed. 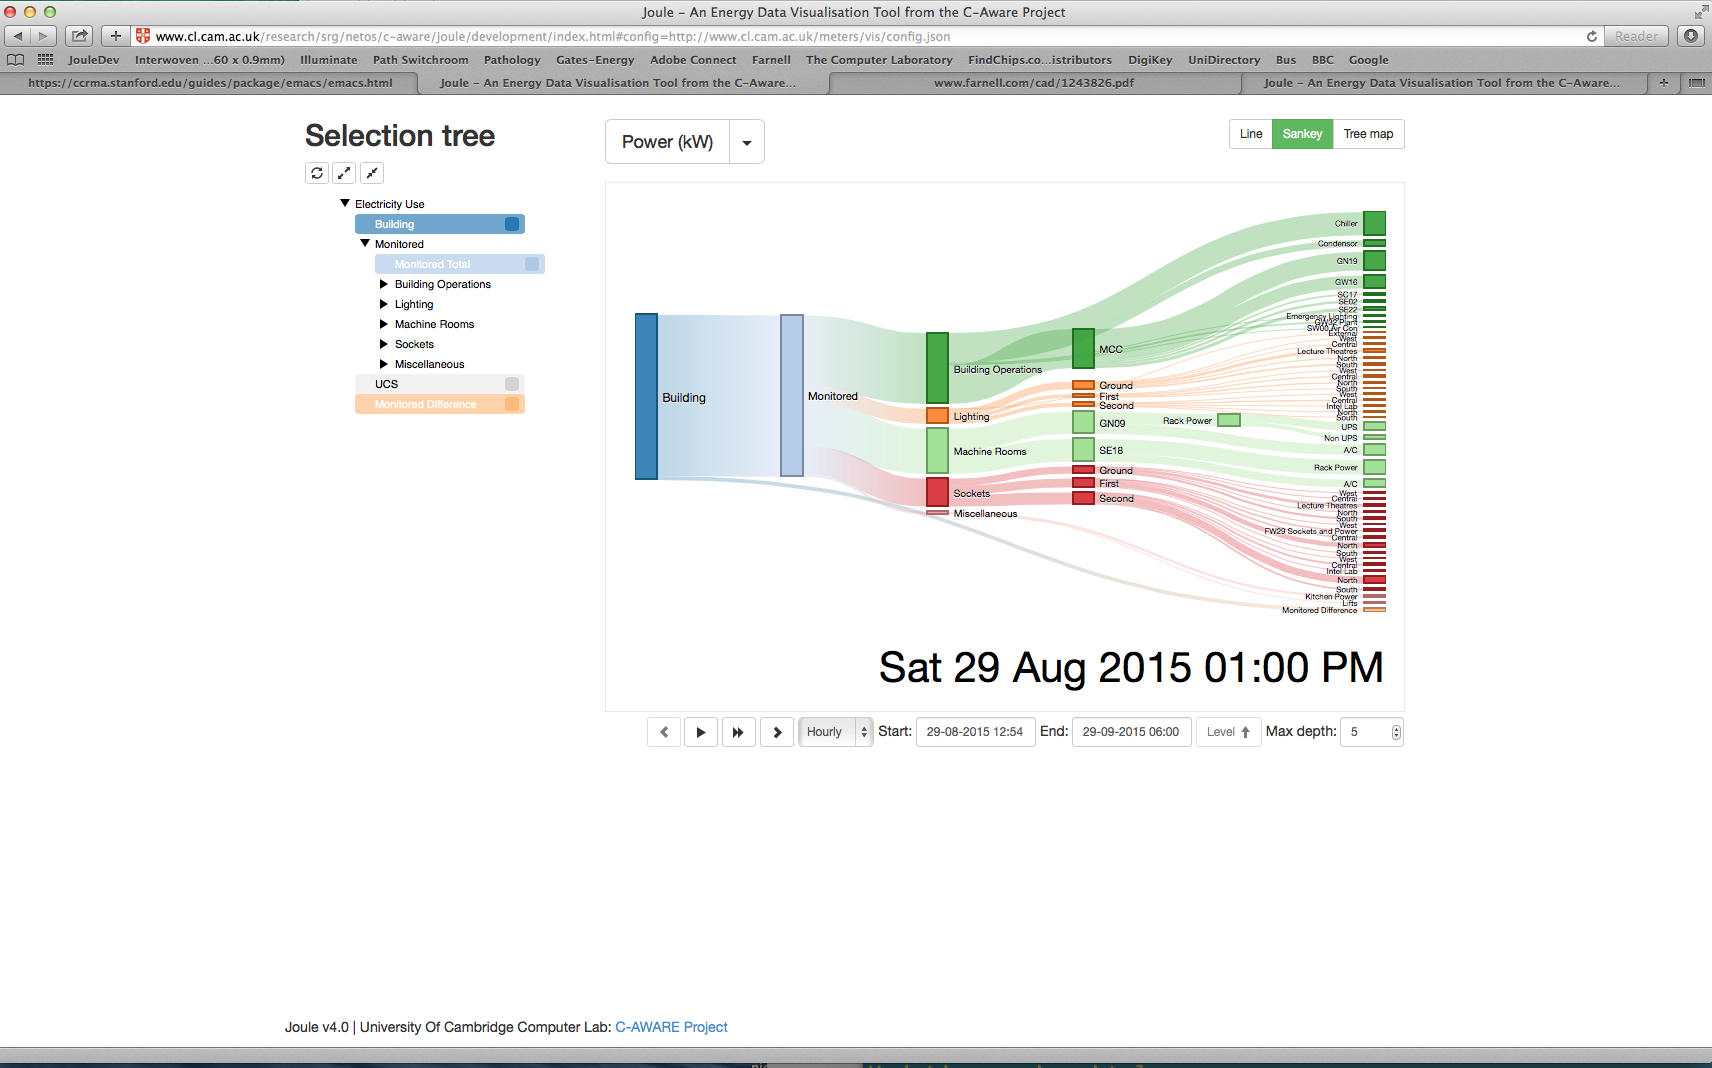
This screen shot shows a Sankey diagram. The directory tree of meters to the left of the plot can be used to control which part of the flow you want to display (eg Lighting or Server Rooms). There are buttons below the diagram which can be used to animate the picture through time. (Although this "animation" is just a series of stills with no smoothing. It is also not terribly fast.) |