Figure 8b
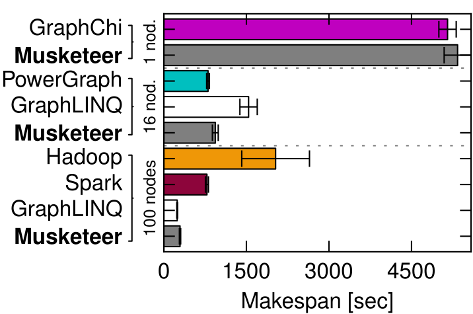
Figure 8b (page 10) is analogous to Figure 3b with Musketeer added. It illustrates that Musketeer matches the performance of the best system choices for PageRank on the Twitter follower graph at three scales.
Our generated code targets GraphLINQ, PowerGraph and GraphChi, respectively. Musketeer can also generated code for the other systems, but we only show the best choice at each scale here.
Figure 8b
Under construction: we will add information on the experimental setup and our data sets here shortly.
If you are interested in being notified when the data appears,
please join our
musketeer-announce mailing list.
Thanks for your patience.
-- The Musketeer team.
Experimental setup
This experiment was executed on an Amazon EC2 cluster comprising of 100 instances. Please check the clusters page for more details.
Result data set
The raw results for this experiment are available here.
To plot Figure 8b, run the following command:
experiments/plotting_scripts$ python plot_pagerank_nobreakdown.py ../page_rank/ec2/cluster4/stat/pagerank_twitter_naiad_musketeer_merged_ "\\textbf{Musketeer}" ../page_rank/ec2/cluster3/stat/pagerank_twitter_naiad_100nodes_baseline_ "GraphLINQ" ../page_rank/ec2/cluster2/stat/pagerank_twitter_spark_baseline_ "Spark" ../page_rank/ec2/cluster1/stat/pagerank_twitter_hadoop_baseline_ "Hadoop" ../page_rank/ec2/cluster1/stat/pagerank_twitter_powergraph_16nodes_musketeer_ "\\textbf{Musketeer}" ../page_rank/ec2/cluster3/stat/pagerank_twitter_naiad_16nodes_baseline_ "GraphLINQ" ../page_rank/ec2/cluster1/stat/pagerank_twitter_powergraph_16nodes_baseline_ "PowerGraph" ../page_rank/ec2/cluster1/stat/pagerank_twitter_graphchi_musketeer_ "\\textbf{Musketeer}" ../page_rank/ec2/cluster1/stat/pagerank_twitter_graphchi_baseline_ "GraphChi"
The graph will be in twitter_makespan.pdf