Figure 3b
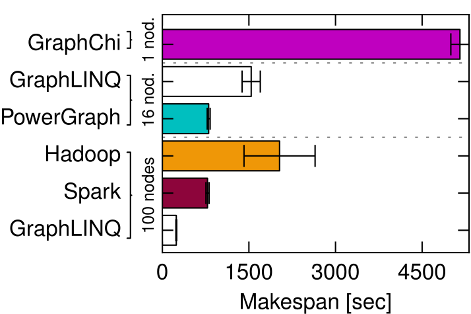
Figure 3b (page 3) illustrates that the best data processing system choice for PageRank on the Twitter follower graph differs depending on scale. Investing more resources reduces overall makespan, but reduces efficiency.
On the large scale of the Twitter graph, scaling to a 100-node cluster using GraphLINQ on Naiad is quickest, but a different system (PowerGraph) performs best at 16-node scale, and outperforms Spark on 100 nodes. GraphChi on 1-node is most efficient: it is less than 100x slower than GraphLINQ on 100 nodes and less than 16x slower than the 16-node deployments.
Figure 3b
Under construction: we will add information on the experimental setup and our data sets here shortly.
If you are interested in being notified when the data appears,
please join our
musketeer-announce mailing list.
Thanks for your patience.
-- The Musketeer team.
Experimental setup
This experiment was executed on Amazon EC2. We ran the computation using 1, 16 and 100 instances. Please check the clusters page for more details.
Result data set
The raw results for this experiment are available here.
To plot Figure 3b, run the following command:
experiments/plotting_scripts$ python plot_pagerank_nobreakdown_motivation.py ../page_rank/ec2/cluster3/stat/pagerank_twitter_naiad_100nodes_baseline_ "GraphLINQ" ../page_rank/ec2/cluster2/stat/pagerank_twitter_spark_baseline_ "Spark" ../page_rank/ec2/cluster1/stat/pagerank_twitter_hadoop_baseline_ "Hadoop" ../page_rank/ec2/cluster1/stat/pagerank_twitter_powergraph_16nodes_baseline_ "PowerGraph" ../page_rank/ec2/cluster3/stat/pagerank_twitter_naiad_16nodes_baseline_ "GraphLINQ" ../page_rank/ec2/cluster1/stat/pagerank_twitter_graphchi_baseline_ "GraphChi"
The graph will be in twitter_makespan.pdf.pdf