Histogram of the tone mapped image: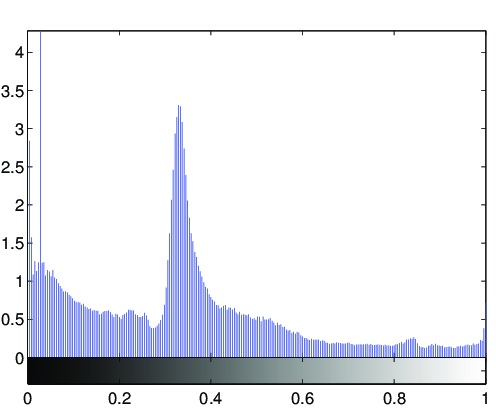
Image statistics of the tone-mapped image:Median percentile of the lightness (CIE L*a*b*): 34.9774Mean of the chroma value (CIE L*a*b*): 14.5187
(evalution of the fit via PSNR: PSNR = 32.1482dB)
Fitted tone curve of the generic tone mapping operator,
compared to the luminance compression done by the tone mapping operator: 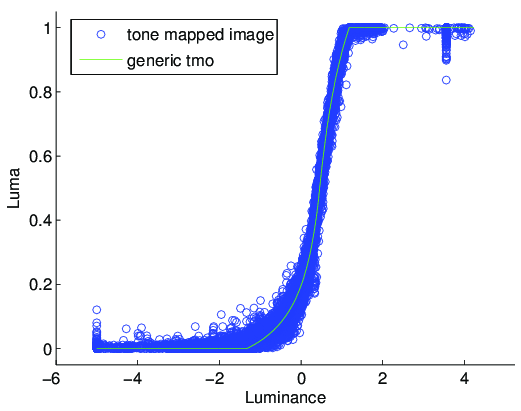
Fitted parameters of the generic tmo:Exposure: 0.45985Contrast: 2.5201Low midtone range: 1.7843High midtone range: 0.72303Saturation: 0.76435Frequencies: 0.622, 0.975, 1.002, 0.993, 0.987