Histogram of the tone mapped image: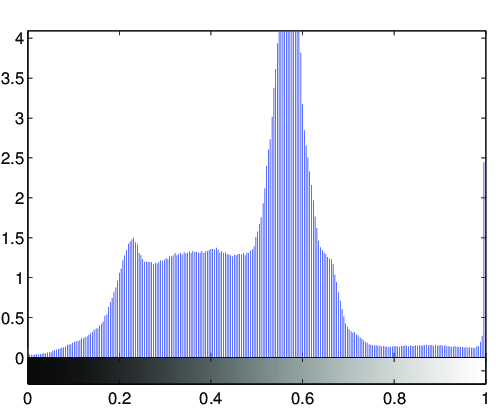
Image statistics of the tone-mapped image:Median percentile of the lightness (CIE L*a*b*): 57.2935Mean of the chroma value (CIE L*a*b*): 12.4947
(evalution of the fit via PSNR: PSNR = 26.7503dB)
Fitted tone curve of the generic tone mapping operator,
compared to the luminance compression done by the tone mapping operator: 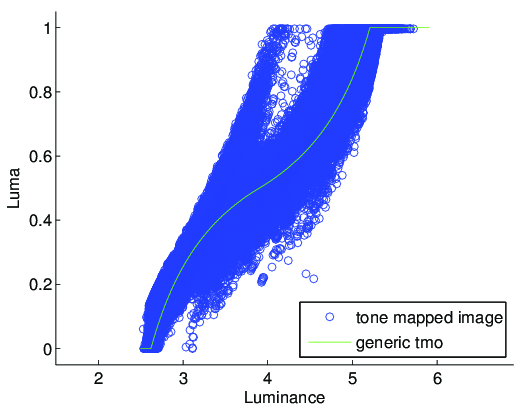
Fitted parameters of the generic tmo:Exposure: 3.9037Contrast: 0.31539Low midtone range: 1.2818High midtone range: 1.305Saturation: 0.7492Frequencies: 1.728, 1.644, 1.762, 1.66, 1.57