Histogram of the tone mapped image: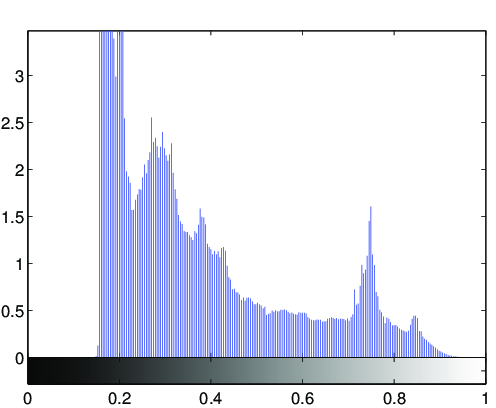
Image statistics of the tone-mapped image:Median percentile of the lightness (CIE L*a*b*): 32.5338Mean of the chroma value (CIE L*a*b*): 7.0756
(evalution of the fit via PSNR: PSNR = 35.581dB)
Fitted tone curve of the generic tone mapping operator,
compared to the luminance compression done by the tone mapping operator: 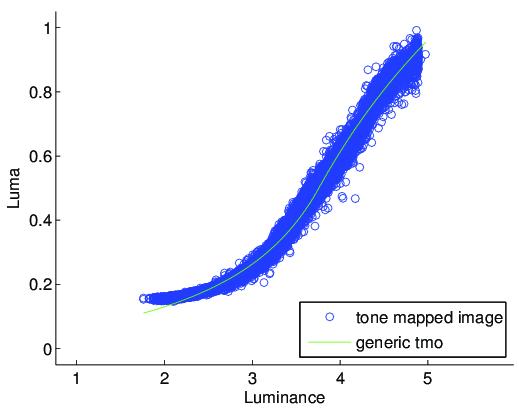
Fitted parameters of the generic tmo:Exposure: 3.7593Contrast: 0.98929Low midtone range: 4.5568High midtone range: 1.3858Saturation: 0.60078Frequencies: -0.045, 0.733, 0.963, 0.982, 1.011