Histogram of the tone mapped image: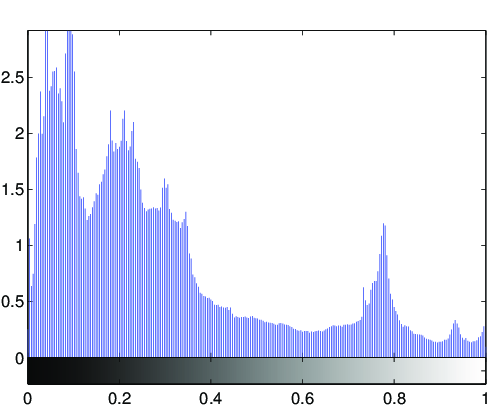
Image statistics of the tone-mapped image:Median percentile of the lightness (CIE L*a*b*): 23.039Mean of the chroma value (CIE L*a*b*): 4.2979
(evalution of the fit via PSNR: PSNR = 38.0896dB)
Fitted tone curve of the generic tone mapping operator,
compared to the luminance compression done by the tone mapping operator: 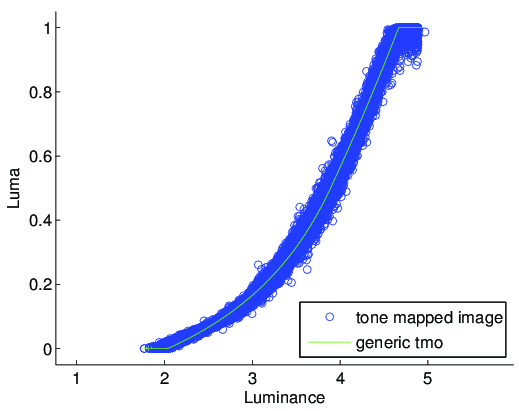
Fitted parameters of the generic tmo:Exposure: 3.8925Contrast: 1.1744Low midtone range: 1.857High midtone range: 0.77602Saturation: 0.4094Frequencies: 0.141, 0.836, 0.985, 0.989, 1.003