
Histogram of the tone mapped image: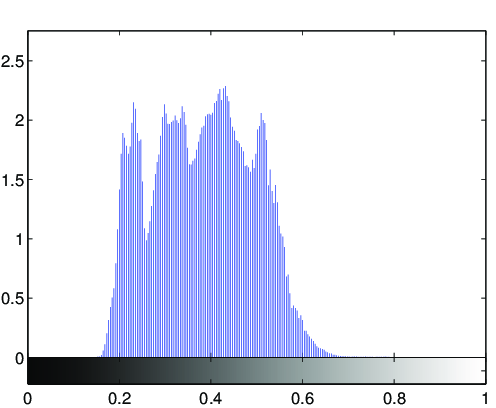
Image statistics of the tone-mapped image:Median percentile of the lightness (CIE L*a*b*): 42.8612Mean of the chroma value (CIE L*a*b*): 36.6313
(evalution of the fit via PSNR: PSNR = 30.0983dB)

Fitted tone curve of the generic tone mapping operator,
compared to the luminance compression done by the tone mapping operator: 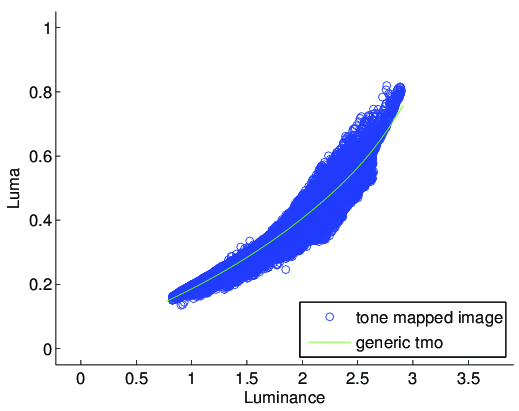
Fitted parameters of the generic tmo:Exposure: 2.3197Contrast: 0.6409Low midtone range: 2.6388High midtone range: 0.90828Saturation: 0.62191Frequencies: 1.573, 1.262, 1.22, 1.226, 1.167