Clasified Trafic
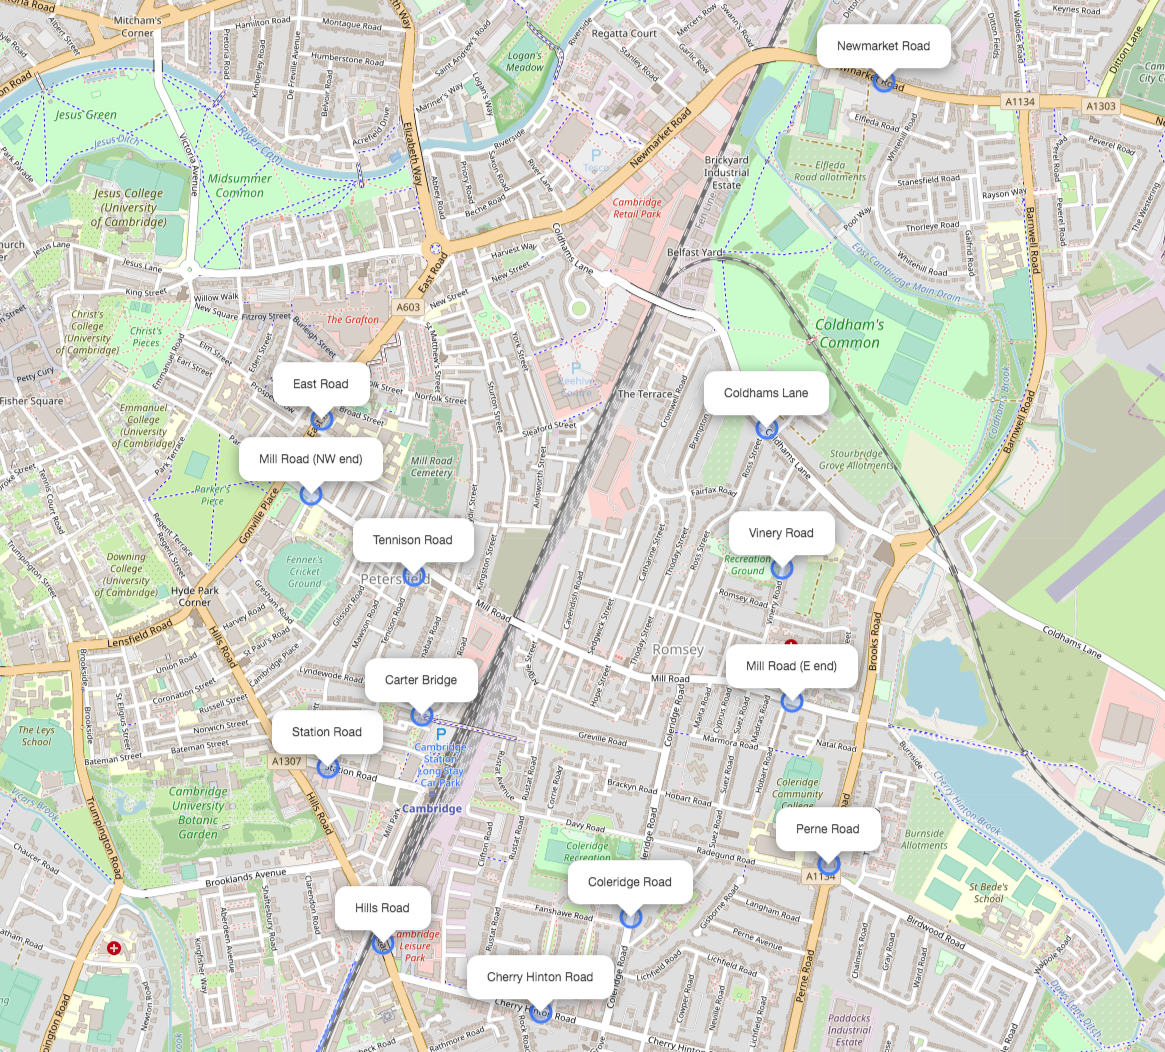
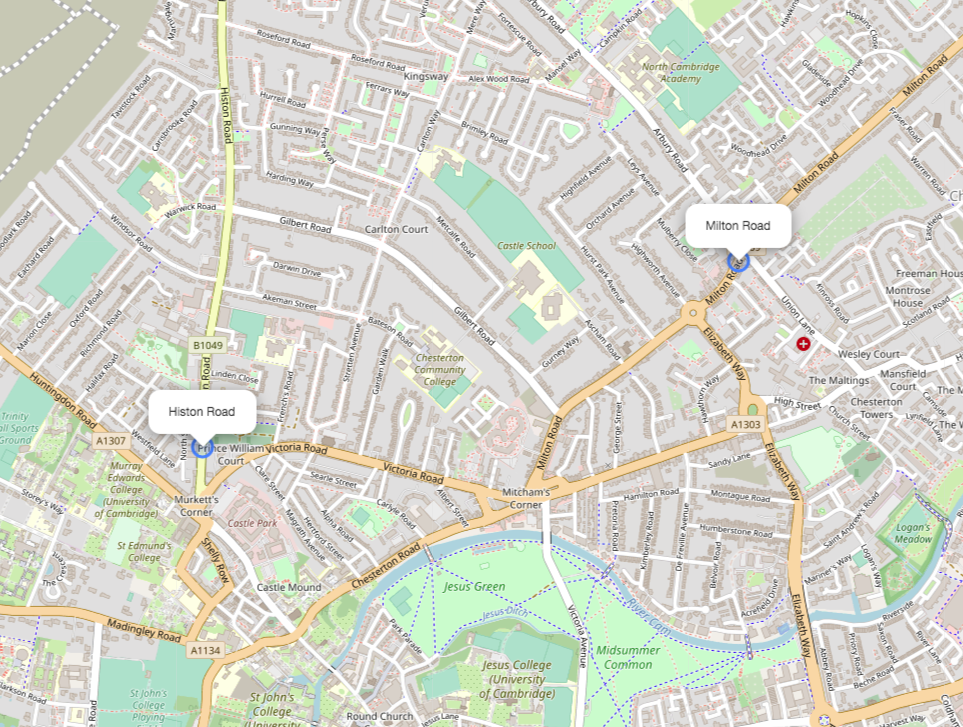
- Locations:
- All Traffic:
- Motor Traffic:
These graphs are derived from the same source as the Mill Road Closure: Traffic Sensor Data data published by Cambridgeshire Insight. There is some background to this data in Cambridgeshire Insight's article Monitoring the impact of Mill Road bridge closure.
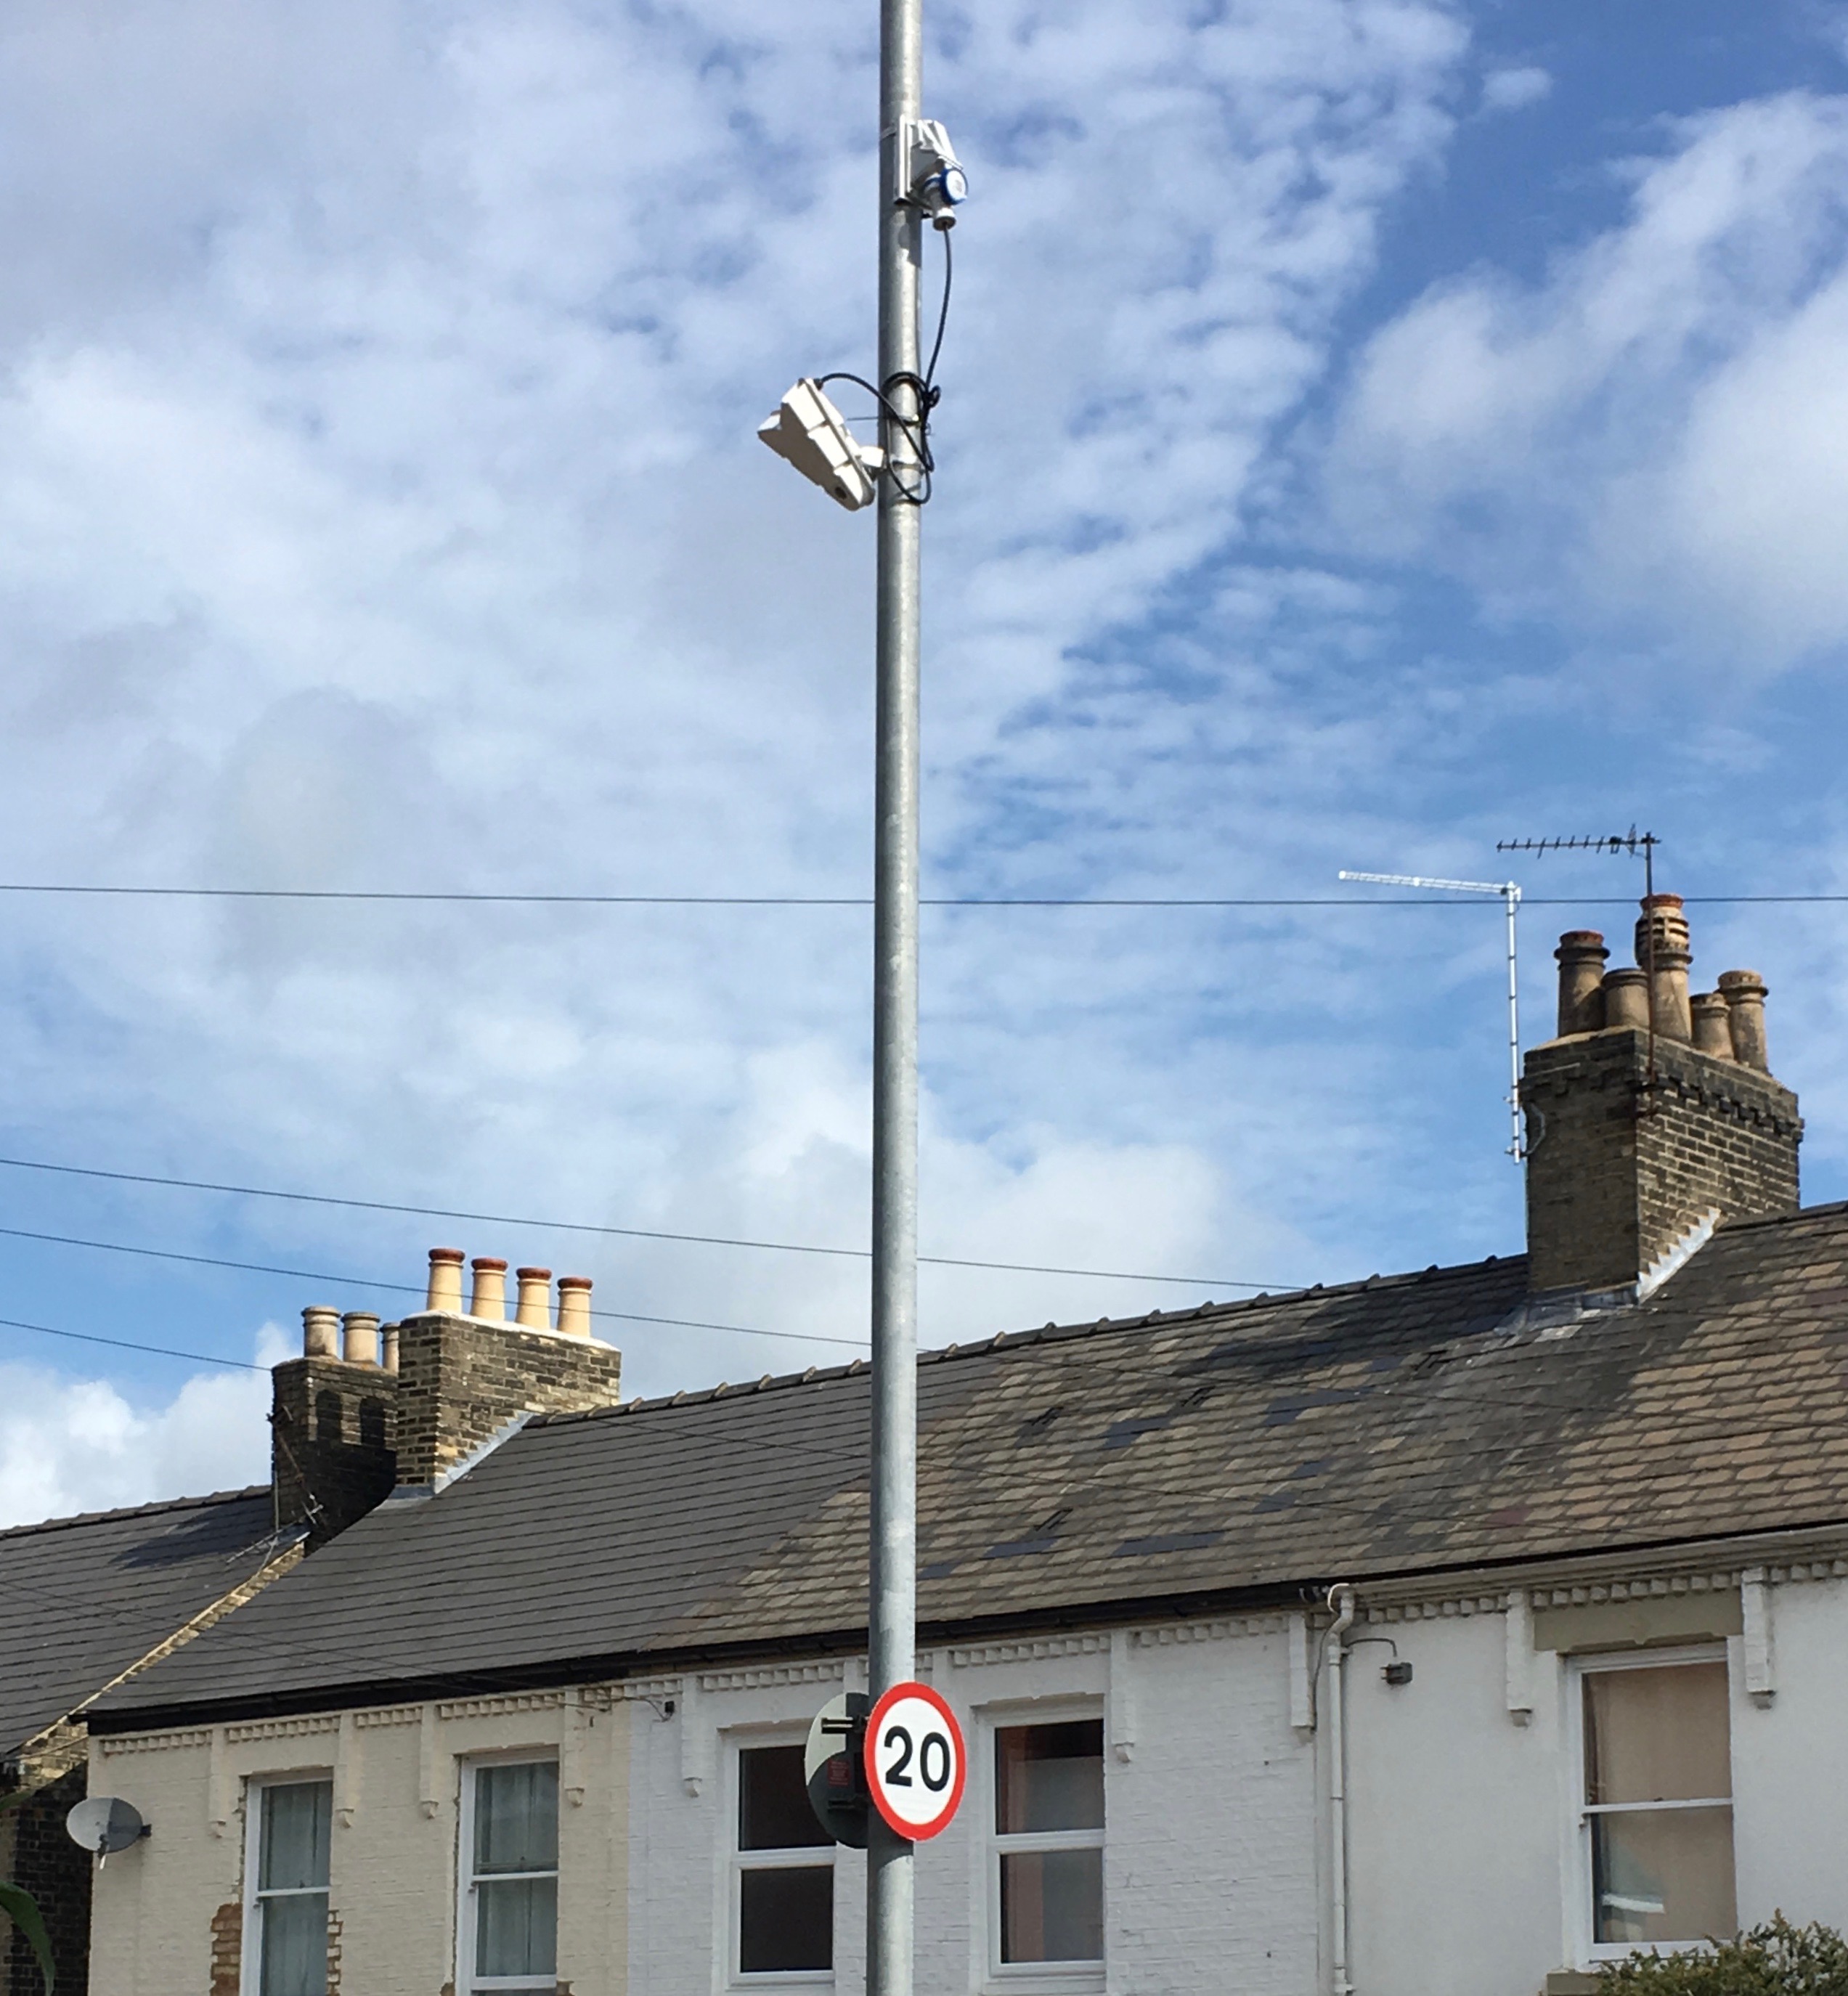
The data comes from sensors that use video cameras and image recognition techniques to identify, classify and count pedestrians, cyclists and various types of motor vehicle crossing a 'virtual' countline in each direction adjacent to the sensor.
These graphs show both daily totals and hourly averages of these counts for various classifications.
The grey shading represents the period that the railway bridge on Mill Road is scheduled to be closed to motor vehicles; the darker grey shading represents the periods that the bridge is additionally scheduled to be closed to pedestrians (and cyclists pushing bikes); the red shading represents the two days that the north-east end of Mill Road and the bridge were completely shut following a serious fire.
The red dashed line represents the mean daily figures aggregated based on the state of the bridge and Cambridgeshire school holidays (a representation first used by the Smarter Cambridge Transport group in a set of posts on Twitter)
Some data is missing for the sensors on Coldhams Lane and Histon Road due to sensor failures.