spEEDO1: Energy Efficiency through Debug suppOrt: On Chip Analytics
|
The next step is to prepare an 'IP package' that enables chip developers to easily implement spEEDO concepts in their new designs. This will perhaps be a work item within spEEDO-2, |
spEEDO-1: A power debug and monitoring API for virtual platforms and real silicon.
Partners: University of Cambridge Computer Laboratory and UltraSoC Ltd.
Funder: The UK TSB (now called Innovate UK).
Dates: October 2013 to June 2014.
Presentation at FOSDEM Feb 2014, Brussels: SLIDES (PDF).
Abstract
spEEDO: Energy Efficiency through Debug suppOrt
Dr David J Greaves.
University of Cambridge Computer Laboratory in Collaboration with UltraSoC Limited.
The spEEDO project aims to augment existing debug APIs (such as GNU's RSP and ARM's Coresight) with a power component for reporting and tracing energy use in multicore systems-on-chip. Energy is logged per IP block and per application thread and reports are made available to the operating system, to applications programs and over the debug interface. The aim is facilitate optimizations for energy-efficiency at all stages of software and silicon development.
Background
Power-efficient design of computer hardware and software is very important. Portable systems, such as smart phones must be power efficient for good battery life and for other reasons. Both hardware designers and software programmers increasing require tools that automate power management. Direct or indirect measurement of power consumption in the running hardware provides the ultimate basis for such decisions. Also important are power-annotated, high-level simulation models and power-aware code generator stages in compilers and in the Android or Java virtual machine.
There is an intrinsic affinity between power management, test and debug. All three rely on information flow outside of the normal system data paths between memories, processor elements and other subsystems. Examples of interdependencies are: 1: debug infrastructure can be used to report power measurements, 2: power management must be overridable by debug hardware to test its own operation and for access to resources that otherwise would be off, and 3: dynamic migration of tasks between processing elements and dynamic reconfiguration of cache and bus structures according to current load requires access to the same counters and other load metrics that are needed for engineering and high-level design exploration.
In addition, the power management and debug interfaces to IP blocks could benefit from standardisation in the same way that the main datapaths have long been converged around a few on-chip standards. If a chip-wide debug architecture is used then a chip-wide power management system should be deployable with the same engineering flow and at the same time. This is a logical next-step in the infrastructure for System-on-Chip design and will be wildly useful.
Aims
Basic Approach
Extend and integrate existing debug protocols and GUIs so that energy and power figures can be conveyed and displayed.
Make a practical demonstrator using OpenOCD/GDB/Eclipse and SystemC TLM Power3.
Strawman Machine Register Interface
First alpha draft.
This is the hardware register set read by an operating system kernel running on a core on the SoC.
This is a typical example. The techniques used by GNU oprofile for portability over architectures can be used.
// Typical hardware register to implement the spEEDO hardware API.

#define SPEEDO_REG_MONICA            0   // Contains an identifying constant
#define SPEEDO_REG_ABI               8   // Version number of the interface
#define SPEEDO_REG_ENERGY_UNITS      16  //  This is the fraction of a Joule in the energy registers. Constant.
#define SPEEDO_REG_CMD_STATUS        40  // Capability description and commands for resetting totals and so on and also the current hardware context.
#define SPEEDO_REG_TIME_UNITS        56  // Numer of femtoseconds for each tick in the time register(s).
#define SPEEDO_REG_CORE_ID           64  // Core / Customer Number Identifier
#define SPEEDO_REG_CTX_CTRL          72  // Low 8 bits is number of h/w contexts (ro), bits 15-8 are current active context (r/w).
                                         // The active context is the one being updated in h/w. The remaining contexts are passive.

#define SPEEDO_REG_CTX0_BASE     512         // active
#define SPEEDO_REG_CTX1_BASE     (512+256)   // shadow for easy read of 64-bit values over 32 bit bus.

#define SPEEDO_REFLECTION_URL0   1024 // First location of a canned URL giving further information on this ABI


// There is only one context per cpu core on our current h/w implementation but it is visible in active and shadow forms
// The active is copied to the shadow as a side effect of writing any value to the CTX_CTRL register.

// The active CTX is CTX0 and CTX1 is the shadow.

//
// Each hardware context contains:
#define SPEEDO_CTX_REG_LOCAL_ENERGY  8  // Running local energy in the units given
#define SPEEDO_CTX_REG_LOCAL_TIME    16 // Running local time (if implemented) for the context in the time units given
#define SPEEDO_CTX_REG_GLOBAL_ENERGY 24  // Running total energy in the units given - includes local energy

// Interrupts?
// Do we want an interrupt watchpoint on these registers - e.g. interrupt every so many microjoules used?


// Sometimes the system has a separate resource for timer ticks, needed  so that energy reports can be
// converted to power.  A hardware abstraction layer or device driver for this register set will integrate the time factor
// and provide the PET account abstraction.


// spEEDO monica is the following data (or low 32 bits of on a D32 machine).
//      data = ((u64_t)'s' << 0) | ((u64_t)'p' << 8) | ((u64_t)'E' << 16) | ((u64_t)'E' << 24) | ((u64_t)'D' << 32) | ((u64_t)'O' << 40);

#define SPEEDO_API_ALPHA    1000  // This value is returned by the ABI register in the prototype implementation.

// The values returned in the energy registers need to be divided by the value in the units register to give a figure in Joules.
#define SPEEDO_UNIT_pJ      (1000*1000*1000*1000)  //
#define SPEEDO_UNIT_nJ      (1000*1000*1000)
#define SPEEDO_UNIT_uJ      (1000*1000)
#define SPEEDO_UNIT_mJ      (1000)
#define SPEEDO_UNIT_UNCAL   0 // The UNCAL value shall be returned if the calibration of the energy registers is unknown.
Strawman C-language API
First alpha draft.
Customer Number
The API uses the concept of a customer number. This is an opaque handle that is actually an integer with various bit fields used for custom purposes on a specific platform. We have standard accessor functions to access the bit fields. These generally include:
typedef unsigned int customer_t; // Value zero is reserved to denote the system global total.


extern customer_t get_local_customer_no();
extern int get_context_field(customer_t c);
extern int get_core_field(customer_t c);

int get_local_core_no()    { return get_core_field(get_local_customer_no()); }
int get_local_context_no() { return get_context_field(get_local_customer_no()); }
HAL-exported API
C language 32-bit API - bare metal/single threaded for local core.
 extern u32_t get_units();

 extern u32_t get_local_energy(); // same as get_customer_energy(get_local_core_no());

 extern u32_t get_customer_energy(customer_t customer_no);

 extern u32_t get_global_energy();

 extern const char *get_reflection_uri();

 extern int reset_energy_counters(u32_t mask);
  // Returns 0 if ok.
  // Returns -ve error code if a selected register cannot be reset.

extern float report_average_power(customer_t no, int window_milliseconds) ... // TBD some running average indication
C language 32-bit API - multi-tasking extensions
It is preferable to support at least two hardware contexts so that one can be active while the other is paused and being context swapped.
 extern int set_current_customer(int core_no, int context_no);

// Depending on the hardware implementation, an access-denied type of error may be
// returned if the core_no is not the local core.
This will set the current virtual context number for the specified core. The underlying hardware may support multiple contexts and so no context swap is needed. Or else the hardware abstraction layer will replace the current settings with new settings. Having a minimum of two hardware contexts is helpful to enable an atomic swap from one set to the other with no energy potentially lost between reading and writing an active register.
// Return codes for C-API
#define SPEEDO_RC_NO_POWER_MONITOR -199
#define SPEEDO_RC_INVALID_REG -99
Architecture
Power Supply Monitoring
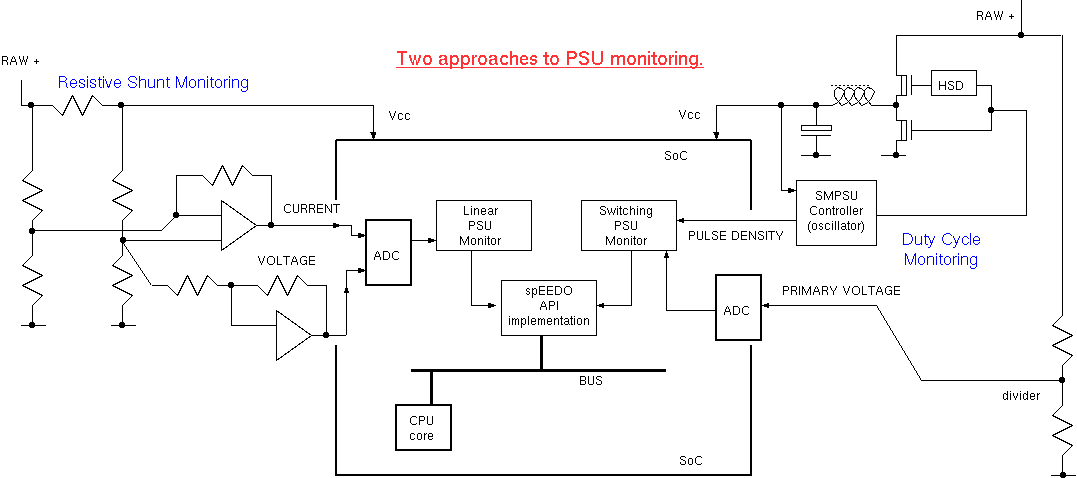
Overall Architecture - for feedback to local software
The kernel keeps task control blocks for each context. The energy aggregate can be kept in this alongside the CPU time aggregate commonly maintained.
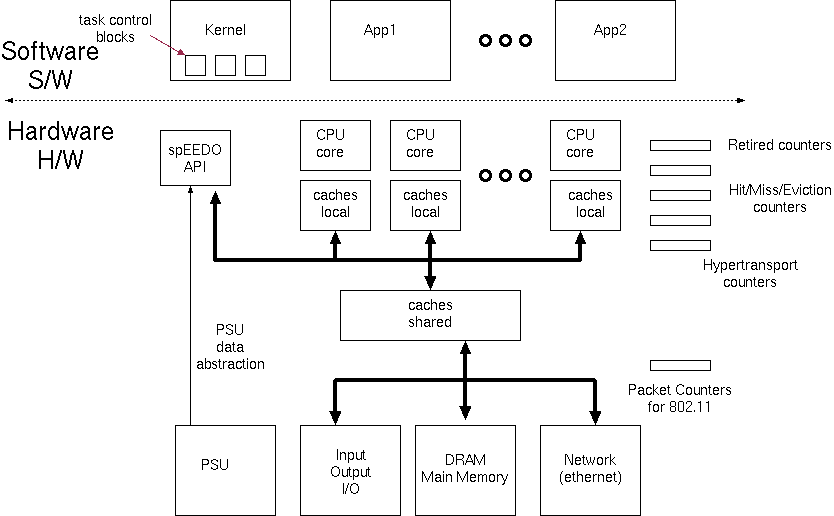
We can use user sideband signals which are part of many on-chip busses (or just otherwise undecoded, higher-order address bits) to carry customer identifiers to index banked energy registers in peripherals. On our SystemC model a 'customer_id' field is instead used in the 'generic payload' passed between IP blocks.
Using Event Counters in Hardware and Device Drivers
There are many event counters already present in contemporary systems. See oprofile and /sbin/ifconfig for instance. With appropriate calibration factors the hardware abstraction layer can multiply these up to give energy estimates. For per-customer energy profiling, these energy figures can be context swapped by the kernel as virtual registers.
Typical device driver stats:
eth0      Link encap:Ethernet  HWaddr 00:13:20:84:5d:81
          inet addr:128.232.9.140  Bcast:128.232.15.255  Mask:255.255.240.0
          inet6 addr: fe80::213:20ff:fe84:5d81/64 Scope:Link
          UP BROADCAST RUNNING MULTICAST  MTU:1500  Metric:1
          RX packets:24110214 errors:0 dropped:0 overruns:0 frame:0
          TX packets:15028627 errors:0 dropped:0 overruns:0 carrier:0
          collisions:0 txqueuelen:100
          RX bytes:3461755890 (3.4 GB)  TX bytes:15455753259 (15.4 GB)
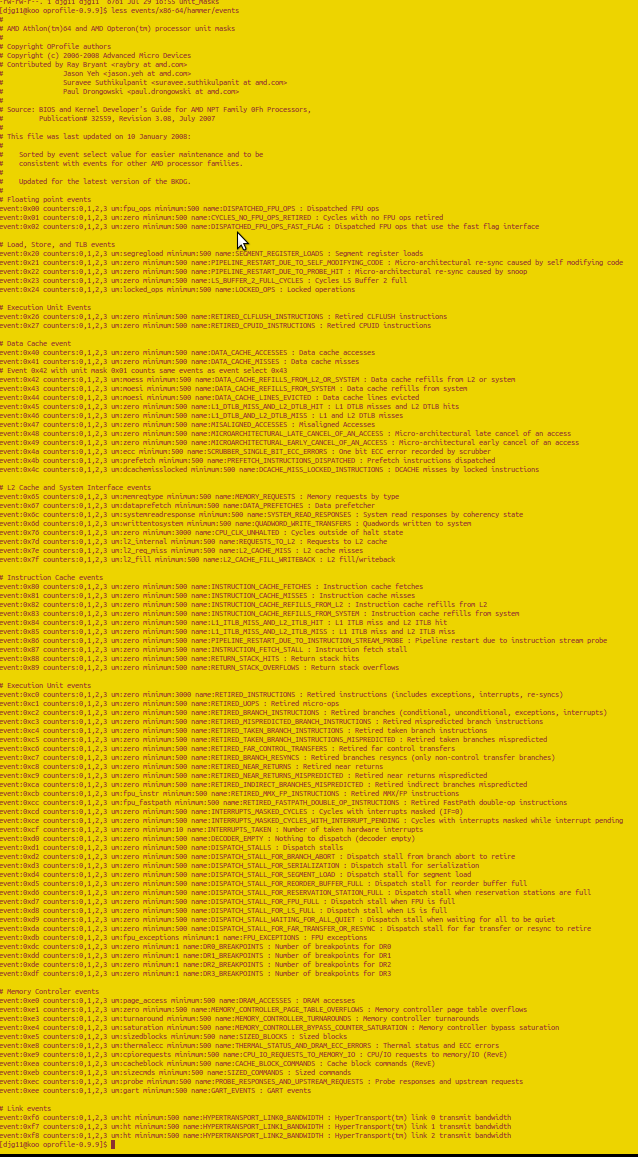
Here are, for example, the oprofile events monitored on the x86-64 AMD hammer architectures:
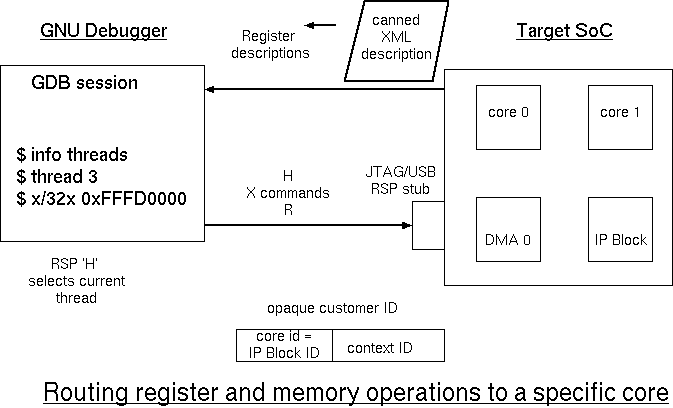
GDB Abuse and Extensions for remote debugging
Experiments
Experiment 1: Single-threaded register interface test
The following simple test program was run bare metal on the VHLS/Prazor simulator implemented in SystemC TLM. The simulation setup was a simple as possible: one OpenRISC core with no caches, one DRAM bank and one UART.
#define SOCDAM_SPEEDO_REGS_BASE   0xFFFD0000
#define READ_SPEEDO(X)    (((unsigned int  *)(SOCDAM_SPEEDO_REGS_BASE + X))[0])


int main(int argc, char *argv[])
{
  int j;
  printf("Hello World %x\n", READ_SPEEDO(SPEEDO_REG_MONICA));
  printf("Global energy units at start are %i\n", READ_SPEEDO(SPEEDO_REG_GLOBAL_ENERGY));
  for (j = 0; j < 10; j++)
    {
      int le = READ_SPEEDO(SPEEDO_REG_CTX0_BASE + SPEEDO_CTX_REG_LOCAL_ENERGY);
      printf("Core %i: Energy units are %i\n", SOCDAM_READ_PID_REG(0), le);
    }

  printf("Global energy units at end are %i\n", READ_SPEEDO(SPEEDO_REG_GLOBAL_ENERGY));
  _killsim(0); // This makes a nice exit from SystemC - seems better at making or1ksmp exit!
}
Power Report File
################################################################################
#              TLM POWER 3.1  (University of Cambridge, UK)                    #
#                                                                              #
#                Statistics file: energy/power consumption.                    #
# ---------------------------------------------------------------------------- #
# For more information see the TLM POWER3 manual pdf.                   p      #
# ---------------------------------------------------------------------------- #
# Creation Date: 17:35:43 -- 25/01/2014                                        #
################################################################################


Title: notitle
# Simulation duration 9997983 ns(sc=9997983 ns)
+--------------------------+-----------------------------+-----------------------------+-----------------------------+
| MODULE  NAME             |              STATIC0 ENERGY |             DYNAMIC1 ENERGY |              WIRING2 ENERGY |
+--------------------------+-----------------------------+-----------------------------+-----------------------------+
Standalone modules:
| ...top.coreunit_0.core_0 |       9.997983e-05J   0.77% |        3.25128e-05J   0.25% |     1.35116151e-07J   0.00% |
| Memory 0 (DRAM)          |      0.00866173075J  66.65% |      0.00419979737J  32.32% |     1.32334593e-07J   0.00% |
| the_top.uart0            |                  0J   0.00% |           8.84e-07J   0.01% |          2.746e-12J   0.00% |
Customer Accounts:
| anonymous                |      0.00866173075J  66.65% |        3.25128e-05J   0.25% |      2.6745349e-07J   0.00% |
| busaccess_0              |                  0J   0.00% |      0.00420136352J  32.33% |                  0J   0.00% |
+--------------------------+-----------------------------+-----------------------------+-----------------------------+
| TOP LEVEL++              |      0.00876171058J  67.42% |      0.00423387632J  32.58% |      2.6745349e-07J   0.00% |
+--------------------------+-----------------------------+-----------------------------+-----------------------------+
Each line is for a separately-traced subsystem. These lines may be neither disjoint or complete.
The TOP LEVEL figure is simply another line in the table that relates to the highest module found.
Total energy used: 12900 uJ  (12995854356318 fJ)


+--------------------------+-----------------------------+-----------------------------+-----------------------------+
| MODULE  NAME             |               STATIC0 POWER |              DYNAMIC1 POWER |               WIRING2 POWER |
+--------------------------+-----------------------------+-----------------------------+-----------------------------+
Standalone modules:
| ...top.coreunit_0.core_0 |               0.01W  75.38% |      0.00325193592W  24.51% |     1.35143409e-05W   0.10% |
| Memory 0 (DRAM)          |        0.866347818W  67.35% |        0.420064464W  32.65% |      1.3236129e-05W   0.00% |
| the_top.uart0            |                  0W   0.00% |     8.84178339e-05W 100.00% |        2.74655e-10W   0.00% |
Customer Accounts:
| anonymous                |        0.866347818W  99.62% |      0.00325193592W   0.37% |     2.67507446e-05W   0.00% |
| busaccess_0              |                  0W   0.00% |        0.420221111W 100.00% |                  0W   0.00% |
+--------------------------+-----------------------------+-----------------------------+-----------------------------+
| TOP LEVEL++              |        0.876347818W  67.42% |        0.423473047W  32.58% |     2.67507446e-05W   0.00% |
+--------------------------+-----------------------------+-----------------------------+-----------------------------+
Each line is for a separately-traced subsystem. These lines may be neither disjoint or complete.
The TOP LEVEL figure is simply another line in the table that relates to the highest module found.
Average power used: 1290 mW  (1299847614895725 fW)
UART Output
The thing to note is that the CPU core is able to see the energy consumed by the DRAM on its behalf.Hello World 45457073 Global energy units at start are 847327 Core 0: Energy units are 524070 Core 0: Energy units are 846693 Core 0: Energy units are 1171122 Core 0: Energy units are 1511514 Core 0: Energy units are 1852918 Core 0: Energy units are 2195073 Core 0: Energy units are 2537936 Core 0: Energy units are 2880756 Core 0: Energy units are 3224286 Core 0: Energy units are 3568353 Global energy units at end are 12006801
With two cores in the simulation, where the second core sits in a spin loop, we get the following report. The DRAM energy can be seen to be roughly shared between the two customer cores.
################################################################################
#              TLM POWER 3.1  (University of Cambridge, UK)                    #
#                                                                              #
#                Statistics file: energy/power consumption.                    #
# ---------------------------------------------------------------------------- #
# For more information see the TLM POWER3 manual pdf.                   p      #
# ---------------------------------------------------------------------------- #
# Creation Date: 17:32:43 -- 25/01/2014                                        #
################################################################################


Title: notitle
# Simulation duration 4806 ns(sc=4806 ns)
+--------------------------+-----------------------------+-----------------------------+-----------------------------+
| MODULE  NAME             |              STATIC0 ENERGY |             DYNAMIC1 ENERGY |              WIRING2 ENERGY |
+--------------------------+-----------------------------+-----------------------------+-----------------------------+
Standalone modules:
| ...top.coreunit_0.core_0 |          4.806e-08J   0.30% |            1.3e-08J   0.08% |         9.0815e-11J   0.00% |
| ...top.coreunit_1.core_1 |          4.806e-08J   0.30% |           1.46e-08J   0.09% |          8.411e-11J   0.00% |
| Memory 0 (DRAM)          |     1.04443197e-05J  64.51% |      5.6217599e-06J  34.72% |        1.46992e-10J   0.00% |
Customer Accounts:
| anonymous                |     1.04443197e-05J  64.51% |           2.76e-08J   0.17% |        3.21917e-10J   0.00% |
| busaccess_0              |                  0J   0.00% |     2.89187835e-06J  17.86% |                  0J   0.00% |
| busaccess_1              |                  0J   0.00% |     2.73060475e-06J  16.87% |                  0J   0.00% |
+--------------------------+-----------------------------+-----------------------------+-----------------------------+
| TOP LEVEL++              |     1.05404397e-05J  65.10% |      5.6500831e-06J  34.90% |        3.21917e-10J   0.00% |
+--------------------------+-----------------------------+-----------------------------+-----------------------------+
Each line is for a separately-traced subsystem. These lines may be neither disjoint or complete.
The TOP LEVEL figure is simply another line in the table that relates to the highest module found.
Total energy used: 16100 nJ  (16190844749 fJ)


+--------------------------+-----------------------------+-----------------------------+-----------------------------+
| MODULE  NAME             |               STATIC0 POWER |              DYNAMIC1 POWER |               WIRING2 POWER |
+--------------------------+-----------------------------+-----------------------------+-----------------------------+
Standalone modules:
| ...top.coreunit_0.core_0 |               0.01W  78.59% |      0.00270495214W  21.26% |     1.88961715e-05W   0.15% |
| ...top.coreunit_1.core_1 |               0.01W  76.60% |      0.00303786933W  23.27% |     1.75010404e-05W   0.13% |
| Memory 0 (DRAM)          |         2.17318346W  65.01% |         1.16973781W  34.99% |      3.0585102e-05W   0.00% |
Customer Accounts:
| anonymous                |         2.17318346W  99.73% |      0.00574282147W   0.26% |     6.69823138e-05W   0.00% |
| busaccess_0              |                  0W   0.00% |        0.601722503W 100.00% |                  0W   0.00% |
| busaccess_1              |                  0W   0.00% |        0.568165783W 100.00% |                  0W   0.00% |
+--------------------------+-----------------------------+-----------------------------+-----------------------------+
| TOP LEVEL++              |         2.19318346W  65.10% |         1.17563111W  34.90% |     6.69823138e-05W   0.00% |
+--------------------------+-----------------------------+-----------------------------+-----------------------------+
Each line is for a separately-traced subsystem. These lines may be neither disjoint or complete.
The TOP LEVEL figure is simply another line in the table that relates to the highest module found.
Average power used: 3360 mW  (3368881554099043 fW)
Interactive GDB power/energy inspection.
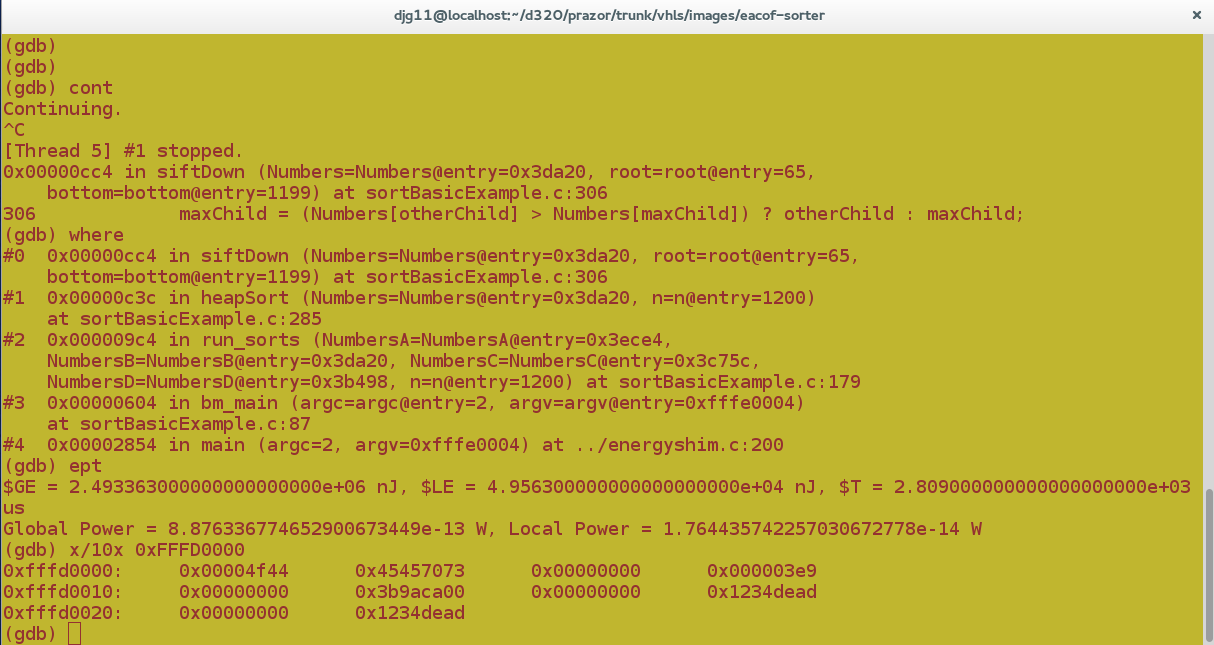
Debugger Access to Powered-Down Regions
As well as extending the RSP protocol/schema of gnu's debugger, gdb, to support reporting energy units we are also putting in some hooks for debug access to power-gated regions. This will amount to recording ancillary steps that are needed to run certain primary debug operations and making gdb or on-chip hardware trigger these steps automatically when needed.
Extensions
The API extension being worked on at the moment is watchpoint triggering.
Watchpoint Triggering and Custom FSM
The customer number has shown itself useful, giving a new form of energy subtotal. An extension is to split this in yet another dimension - the time domain. Using the existing (or spEEDO-specific) watchpoints and triggers in the hardware platform we can checkpoint or context switch the customer energy account. For instance, watchpoints on a processor PC that delimit one specific subroutine body enable collection of energy used just while in that subroutine.
Using an ld linker script it is quite easy to put a collection of subroutines in a given virtual segment that turns into consecutive memory locations in the main code segment (instruction space). It is then trivial to set the watchpoint region to be the start and end of this virtual segment.
For embedded systems and kernel code there is very little intrusion arising from inserting explicit on/off/switch instructions in the code to delimit a temporal extent. But this would be much more invasive if directed from user space using system calls on linux etc..
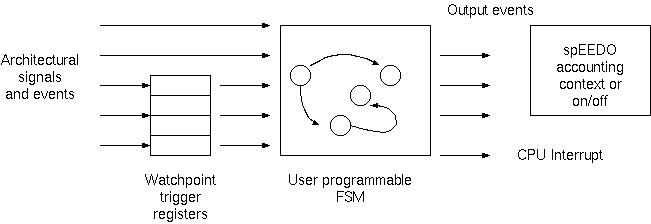
But in general, we have a number of watchpoint triggers - based on many microarchitecture features, such as instruction address, operand address, processing mode, read/write/execute and cache and memory subsystem events. Each such trigger is given a trigger name. The user may define one or more finite statemachines which each have a number of possible states. He defines the triggering transitions between states. He defines output behaviour as well, which, most importantly, contains an on/off control or accounting context.
Scheduller Integration
We will have a go at getting the linux scheduler to do context measurements by accessing the RAPL energy registers on an Intel motherboard.
(Potential) Achievements
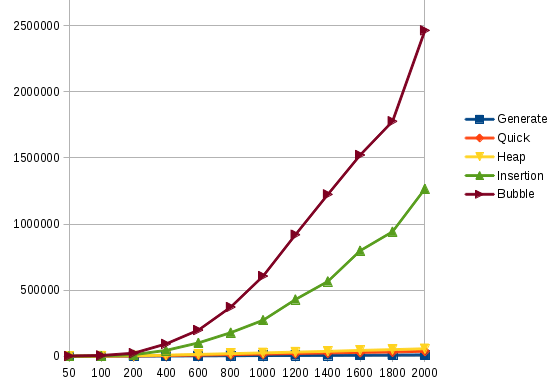
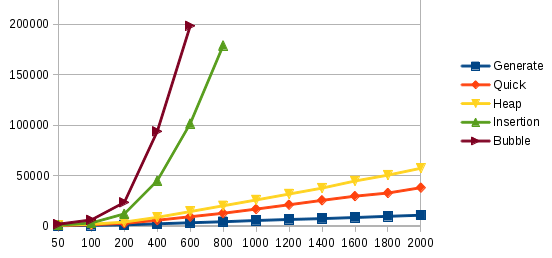
The EACOF distribution contains a demo program that sorts data with four different algorithms and records the energy use. SRC CODE. We have run that program on our platforms that have also used a simple spEEDO to EACOF convergence layer so that the spEEDO energy logging is available through the EACOF API.
The following plot was generated. It shows linear, n log n and quadratic energy use as expected. The second plot is a close up of the first plot.
We need further plots exploring multiprocessing crosstalk...
Demo July 2014
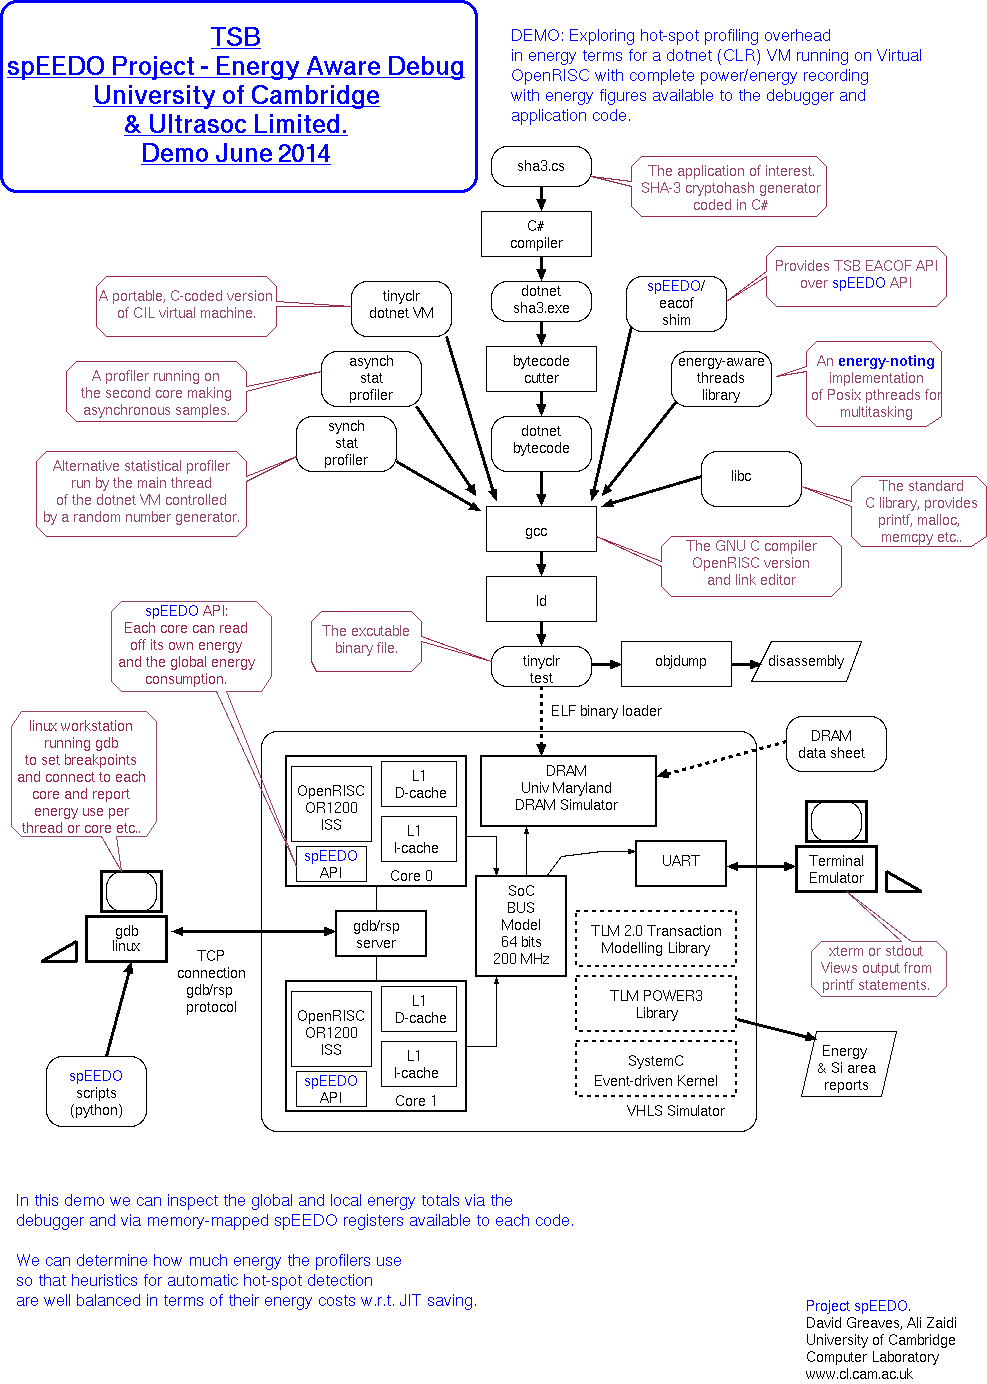
Typical output:
Answer 578951E24EFD62A3D63A86F7CD19AAA53C898FE287D2552133220370240B572D
Done
Exiting.Running finished
Profile report Asynch
  Method rot'2'System/UInt64, System/UInt64  33.043478       (76/230)
  Method Chi'2'[A]System/UInt64, [A]System/UInt64  19.791666       (38/192)
  Method Theta'4'[A]System/UInt64, [A]System/UInt64, [A]System/UInt64, [A]System/UInt64  33.333333       (4/12)
  Method ToUInt64'1'System/Byte  16.666666       (2/12)
  Method Clear'3'System/Array, System/Int32, System/Int32  25.0       (1/4)
  Method WriteLine'2'System/String, System/Object  33.333333       (1/3)
  Method Clear'3'System/Array, System/Int32, System/Int32  50.0       (1/2)

Profile report Synch
  Method rot'2'System/UInt64, System/UInt64  11.593635       (4445/38340)
  Method Chi'2'[A]System/UInt64, [A]System/UInt64  7.6228878       (1985/26040)
  Method Theta'4'[A]System/UInt64, [A]System/UInt64, [A]System/UInt64, [A]System/UInt64  13.885041       (401/2888)
  Method ToUInt64'1'System/Byte  6.8396226       (145/2120)
  Method RhoPi'2'[A]System/UInt64, [A]System/UInt64  6.6666666       (90/1350)
  Method Iota'2'[A]System/UInt64, System/UInt64  8.3809523       (44/525)
  Method Clear'3'System/Array, System/Int32, System/Int32  8.3333333       (41/492)
  Method WriteLine'3'System/String, System/Object, System/Object  16.129032       (25/155)
  Method Execute'4'System/Int32, System/Int32, System/Int32, [A]System/Byte  13.274336       (15/113)
  Method Clear'3'System/Array, System/Int32, System/Int32  12.612612       (14/111)
Profile reports end
Info: /OSCI/SystemC: Simulation stopped by user.
Note: sc_time_max is 1 ps
the_top.memory0:end_of_simulation DRAM stats: read_ops=125991, write_ops=31986, read_bytes=8063424, write_bytes=2047104
the_top.memory1:end_of_simulation DRAM stats: read_ops=0, write_ops=0, read_bytes=0, write_bytes=0
the_top.coreunit_0.l1_d_cache_0: End of simulation: Hits=40649006  Misses=130144 ratio=0.997. SharingEvictions=383 SnoopedReads=4836  Writes=5720362, Reads=35531799 WRITE-BACK/WRITE_ALLOCATE/READ_ALLOCATE
the_top.coreunit_1.l1_d_cache_1: End of simulation: Hits=653775  Misses=896 ratio=0.999. SharingEvictions=19 SnoopedReads=454  Writes=1387, Reads=648571 WRITE-BACK/WRITE_ALLOCATE/READ_ALLOCATE
the_top.busmux0: eos spooled: operations=163685 contended=0
the_top.busmux0: ave response time=98725 ps, ave service_time=98725 ps
ads,core_1.delperiods,core_1.instructions,the_top.coreunit_1.core_1.busaccess.bus-reads,the_top.coreunit_1.core_1.busaccess.bus-writes,the_top.coreunit_0.l1_d_cache_0.sharing_evictions,\
the_top.coreunit_0.l1_d_cache_0.misses,the_top.coreunit_0.l1_d_cache_0.hits,the_top.coreunit_0.l1_d_cache_0.snooped_reads,core_0.delperiods,core_0.instructions,the_top.coreunit_0.core_0\
.busaccess.bus-reads,the_top.coreunit_0.core_0.busaccess.bus-writes
the_top eos stdout
the_top.coreunit_0.core_0 eos stdout  fastiss: or1k core clock period=5 ns
@exit  :  insn #50067971
the_top.coreunit_0.core_0.busaccess eos stdout DMI[0] too_low=0, too_high=0, not_valid=0, linked=0, measure_needed=9034073 aok=0, too_hi_margin=0
the_top.coreunit_0.core_0.busaccess eos stdout DMI[1] too_low=0, too_high=0, not_valid=0, linked=0, measure_needed=26500736 aok=0, too_hi_margin=0
the_top.coreunit_0.core_0.busaccess eos stdout  reads=35534830 dmi_reads=0 writes=5723372
the_top.coreunit_0.l1_d_cache_0: eos stdout: Hits=40649006  Misses=130144 ratio=0.997. SharingEvictions=383 SnoopedReads=4836  Writes=5720362, Reads=35531799 WRITE-BACK/WRITE_ALLOCATE/R\
EAD_ALLOCATE
the_top.coreunit_1.core_1 eos stdout  fastiss: or1k core clock period=5 ns
@exit  :  insn #1162845
Energy report:
################################################################################
#              TLM POWER 3.1  (University of Cambridge, UK)                    #
#                                                                              #
#                Statistics file: energy/power consumption.                    #
# ---------------------------------------------------------------------------- #
# For more information see the TLM POWER3 manual pdf.                   p      #
# ---------------------------------------------------------------------------- #
# Creation Date: 17:35:43 -- 25/01/2014                                        #
################################################################################

Title: harvard
# Simulation duration 259 625 914 440 ps(sc=259625914440 ps)
+--------------------------+-----------------------------+-----------------------------+-----------------------------+
| MODULE  NAME             |              STATIC0 ENERGY |             DYNAMIC1 ENERGY |              WIRING2 ENERGY |
+--------------------------+-----------------------------+-----------------------------+-----------------------------+
Standalone modules:
| ...top.coreunit_0.core_0 |      0.00259625914J   6.62% |       0.0102932662J  26.25% |     3.34652429e-05J   0.09% |
| ...top.coreunit_1.core_1 |      0.00259625914J   6.62% |       0.0002757064J   0.70% |     8.15817356e-07J   0.00% |
| Memory 0 (DRAM)          |      0.00453998544J  11.58% |       0.0021754989J   5.55% |       7.705413e-09J   0.00% |
| the_top.uart0            |                  0J   0.00% |          6.338e-06J   0.02% |        1.86387e-10J   0.00% |
With child components summed:
| ...unit_0.l1_d_cache_0++ |      0.00272639611J   6.95% |      0.00195061054J   4.97% |      2.8652692e-06J   0.01% |
| ...unit_0.l1_i_cache_0++ |      0.00272639611J   6.95% |      0.00368460462J   9.40% |     2.81980888e-05J   0.07% |
| ...unit_1.l1_d_cache_1++ |      0.00272639611J   6.95% |     1.27140712e-05J   0.03% |      3.2400234e-08J   0.00% |
| ...unit_1.l1_i_cache_1++ |      0.00272639611J   6.95% |     0.000105471729J   0.27% |     6.97689199e-07J   0.00% |
Customer Accounts:
| anonymous                |      0.00453998544J  11.58% |       0.0105704019J  26.96% |     6.60823995e-05J   0.17% |
| busaccess_0_ctx0.0       |                  0J   0.00% |      0.00667670696J  17.03% |                  0J   0.00% |
| busaccess_0_ctx1.0       |                  0J   0.00% |      0.00108231029J   2.76% |                  0J   0.00% |
| busaccess_1_ctx0.1       |                  0J   0.00% |     0.000175026176J   0.45% |                  0J   0.00% |
+--------------------------+-----------------------------+-----------------------------+-----------------------------+
| TOP LEVEL++              |       0.0206380882J  52.64% |       0.0185044453J  47.19% |     6.60823995e-05J   0.17% |
+--------------------------+-----------------------------+-----------------------------+-----------------------------+
Average power used: 1290 mW  (1299847614895725 fW)
Links