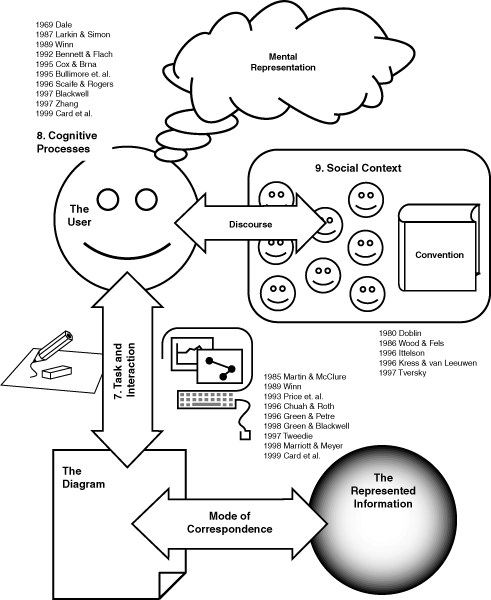
Figure 1. Contextual taxonomic aspects
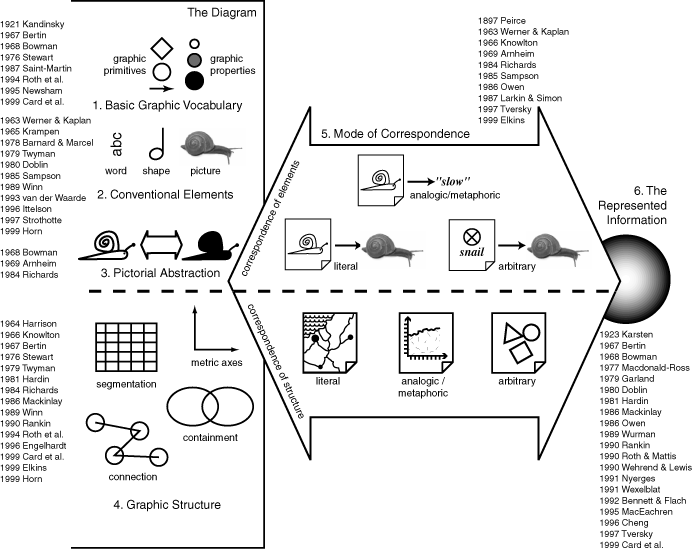
Figure 2. Representation-related taxonomic aspects
Alan F. Blackwell and Yuri Engelhardt
To appear in P. Olivier, M. Anderson & B. Meyer (Eds.), Diagrammatic Representation and Reasoning, Springer-Verlag.
What is the common ground for a science of diagrams? A simple definition of which notations qualify as diagrams, if it were possible to achieve one, is likely to exclude valuable insights. As an alternative we suggest that common ground should be established on a taxonomic basis. A wide range of candidate taxonomies has already been described in several different academic fields. When taxonomies are needed, we propose that the taxonomic precedents should be treated more analytically than simply selecting the most inclusive or rigorous to be extended as necessary.
We do not have space here to describe individual taxonomies in any detail, nor to assess their relative advantages. We recommend the original sources listed in the bibliography. Most of the taxonomies have been proposed from within a small range of academic contexts. An example is that of software engineering notations, including both diagrams used for system design (Martin 1985, Newsham 1995) and visual programming languages (Price 1993). The ergonomic implications of these diagrams have been categorised in the cognitive dimensions of notations (Green 1996). Further examples include the selection of representations for educational contexts (Dale 1969, Goldsmith 1984, Cox 1995), or in cartography, typography, and graphic design (Bertin 1981, Twyman 1979, Richards 1984, MacdonaldRoss 1977, Garland 1979, vanderWaarde 1993, Engelhardt 1998).
The study of aesthetics and representation often generates taxonomic distinctions (Goodman 1969, Ittelson 1996), as do theories of language (Werner 1963, Stewart 1976, Sampson 1985). Psychologists investigate the notational factors underlying cognitive performance both to gain insight into performance (Barnard 1978, Bennett 1992, Hardin 1981), but also as a basis for more general theories of cognition (Larkin 1987, Scaife 1996, Zhang 1997). Some recent reviews have attempted to place previous research into diagram use within a framework of these cognitive questions (Blackwell 1997, Tversky 1997).
The taxonomies that we have studied all propose distinctions concerning some aspect of diagrams or diagram use. Some taxonomic systems make distinctions concerning more than one aspect. In our meta-taxonomy we are classifying these aspects along which the existing taxonomies make their distinctions. This set of taxonomic aspects can be used for comparative study of previous taxonomies, as the basis for creating new taxonomies of diagrams, and also to compare and contrast the research priorities of different fields contributing to the science of diagrams.
| Signs - the components of a diagram: | |
| 1 | Basic graphic vocabulary |
| 2 | Conventional elements |
| 3 | Pictorial abstraction |
| Graphic structure of a diagram: | |
| 4 | Graphic structure |
| Meaning: | |
| 5 | Mode of correspondence |
| 6 | The represented information |
| Context-related aspects: | |
| 7 | Task and interaction |
| 8 | Cognitive processes |
| 9 | Social context |
Note that, although we refer to individual aspects examined in each taxonomy, these are sometimes combined into a matrix or some other multi-dimensional scheme by the original authors.
Figure 1. Contextual taxonomic aspects
Figure 2. Representation-related taxonomic aspects
Our list of aspects was originally derived from our characterisations of the different research interests listed in the beginning of this chapter. We give a more complete description of the research fields motivating research taxonomies in a later section. We should note that, although we proposed this exercise as an alternative to strict definition of the concept of diagram, we do of course make an implicit definition in our selection of research fields. We include disciplines such as cartography and typography whose subject matters (maps and words) might not be considered diagrams. Any visual representation that is not purely textual or purely pictorial can usefully be analysed to discover its diagrammatic content, whether or not it should formally be defined as a "diagram". This has provided us with further breadth of taxonomic perspective, for example from Kandinsky's classification of the fundamental elements of painting.
We can divide the nine aspects into representation related aspects (1-6) and context-related aspects (7-9). The complete context is illustrated structurally in figure 1, and the structural relationship between those aspects that relate specifically to the representation are illustrated in figure 2.
Representation-related aspects are related to the semiotic dyad of Saussure, which connects a representation to its meaning. Peirce's semiotic triangle (1932) introduces the relevance of the interpretant -- the intended result of the communication. In the case of diagrams, the potential interpretants include a great variety of possible contexts: the diagram may be used to communicate information to an audience (which is close to the conventional semiotic triangle), or it may be a sketch manipulated by a person who never intends showing it to anyone or keeping it for any longer than it takes to solve an immediate problem. Because diagrams can be used in so many ways, we refer not to an interpretant, but to a range of possible diagram contexts (aspects 7-9). For example, many diagrams derive their status from the context of task and interaction (7), in which the user interacts actively with the diagram. Equally important is the context of cognitive processes (8), in which we may regard the user as an independent agent, with the context of diagram use being the mental state of the user. Finally we also need to consider social context (9), where the diagram is constructed as a group activity or presented to communicate information.
Representation-related aspects (1-6) deal with those representational properties of diagrams that apply in many different contexts. This relative context-independence results in a potentially formalisable definition of form and meaning. In an earlier version of this chapter we called these aspects context-free, but clearly they do occur in a context, and that context guides the interpretation. However, many taxonomies attempt to describe diagrams in terms of some absolute properties (as if they could be pure, mathematical or context-free), and we adopt this perspective for the purpose of this part of the analysis (aspects 1-6).
Representation-related aspects relate either to the diagram itself (1-4), or to its meaning (5-6). The aspects regarding the diagram itself are concerned with either the signs that are the components of the diagram (1-3), or with the graphic structure of the diagram (4). The aspects regarding meaning are concernd with either mode of correspondence (5) or with the represented information (6). Aspects 1-5 and the many taxonomies that analyse these aspects are discussed in detail in Engelhardt's forthcoming Ph.D. thesis.
This section provides an illustration of the proposed taxonomic aspects of diagrams and diagram use. For each aspect, we will try to point out some specific distinctions that have been proposed in an actual taxonomy, using the London Underground diagram as a familiar example.
Regarding the basic graphic vocabulary (1), Bertin's (1967) analysis of the graphic domain would suggest that the Underground diagram uses two "implantations": "points" (the stations) and "lines" (the connections). These encode information through two of Bertin's "visual variables": "shape" (types of stations), and "color" (different lines). Bowman (1968) would identify the same "vocabulary of form" in the Underground diagram as Bertin: "point, line, shape, color".
Regarding conventional elements (2), Twyman's (1979) analysis of "mode of symbolization" suggests that the Underground diagram contains both "schematic" elements (shapes, such as lines and marks) and "verbal" elements (words, such as the station names).
Regarding pictorial abstraction (3), Richards (1984) describes the "mode of depiction" of the Underground diagram as "non-figurative", since it hardly contains pictorial signs, except maybe for the river Thames.
Regarding graphic structure (4), Richards (1984) points out "organisation" by "linking" (the lines) in the Underground diagram. Twyman (1979), in his spectrum from linear to non-linear "configuration", regards the Underground diagram as a "non-linear" configuration with "directed viewing". Engelhardt (1998), analyzing "meaningful space", would point out the combination here of structuring by both "links" (the lines) as well as by crude geographic topology (the positions). In Lohse et al.'s "classification of visual representations", the assignment of the Underground diagram is not quite clear to us - it could be referred to either as a "map" or as a "structure diagram" or as a "process diagram" or as as a "network chart" in their classification system. Lohse et al.'s distinctions seem to consider both graphic structure (4) and the nature of the represented information (6).
Regarding mode of correspondence (5), Richards classifies the Underground diagram as "semi-literal". Eco (1985, pp. 178-179) points out that the Underground diagram is both "iconic" (in its reference to the layout of tracks through the city) and "symbolic" (in its use of plain circles for stations and straight unidimensional lines for the fragmented routes).
Regarding the represented information (6), the Underground diagram may be considered to be a representation of "spatial" and "ordinal" information, or it may be taken to represent a "sequence of actions" required to reach a particular destination.
Concerning the context-related aspects of the Underground diagram, we note that there has been less empirical investigation of this diagram than there has been semiotic analysis. However, our list of aspects suggest several areas of investigation that could be pursued.
Regarding task and interaction with the Underground diagram (7), we can conjecture about interaction with it on the basis of the observation that maps in the underground are worn out in a patch near the current station. Users presumably put their finger on that patch, then trace a route to where they want to go. The finger seems to be an essential tool for interacting with such representations.
Regarding cognitive processes (8), we note that perceptual attributes of the diagram, including line weights, colour discrimination, font legibility and so on are a prerequisite to its usability. The Underground diagram has also affected mental representations: according to Garland, it has changed people's mental map of distances across London. No doubt the many versions also accommodate interpersonal variation -- versions for use by the visually impaired, for example.
Finally, regarding social context (9), the Underground diagram certainly has a complex cultural and communicative context. When the diagram is printed on a T-shirt, what is its diagrammatic function? The Underground diagram can also be used as a pragmatic substrate for other messages. For example, shops in London often use a customised version of the diagram in their advertisements, to highlight their location.
|
RESEARCHER |
EXAMINED ASPECT |
|||||||||
|
Diagram |
Meaning |
Context |
||||||||
|
Vocab |
Conv |
Abstr |
Struc |
Corr |
Inform |
Ta&In |
Cogni |
Social |
||
|
1897 |
Peirce |
5 |
||||||||
|
1921 |
Kandinsky |
1 |
||||||||
|
1923 |
Karsten |
6 |
||||||||
|
1963 |
Werner & Kaplan |
2 |
5 |
|||||||
|
1964 |
Harrison |
4 |
||||||||
|
1965 |
Barthes |
5 |
||||||||
|
1965 |
Krampen |
2 |
||||||||
|
1966 |
Knowlton |
4 |
5 |
|||||||
|
1967 |
Bertin |
1 |
4 |
6 |
||||||
|
1968 |
Bowman |
1 |
3 |
6 |
||||||
|
1969 |
Arnheim |
3 |
5 |
|||||||
|
1969 |
Dale |
8 |
||||||||
|
1976 |
Stewart |
1 |
4 |
|||||||
|
1977 |
Macdonald-Ross |
6 |
||||||||
|
1978 |
Barnard & Marcel |
2 |
||||||||
|
1979 |
Garland |
6 |
||||||||
|
1979 |
Twyman |
2 |
4 |
|||||||
|
1980 |
Doblin |
2 |
6 |
9 |
||||||
|
1981 |
Hardin |
4 |
6 |
|||||||
|
1984 |
Richards |
3 |
4 |
5 |
||||||
|
1985 |
Martin & McClure |
7 |
||||||||
|
1985 |
Sampson |
2 |
5 |
|||||||
|
1986 |
Mackinlay |
4 |
6 |
|||||||
|
1986 |
Owen |
5 |
6 |
|||||||
|
1986 |
Wood & Fels |
9 |
||||||||
|
1987 |
Larkin & Simon |
5 |
8 |
|||||||
|
1987 |
Saint-Martin |
1 |
||||||||
|
1989 |
Winn |
2 |
4 |
7 |
8 |
|||||
|
1989 |
Wurman |
6 |
||||||||
|
1990 |
Rankin |
4 |
6 |
|||||||
|
1990 |
Roth & Mattis |
6 |
||||||||
|
1990 |
Wehrend & Lewis |
6 |
||||||||
|
1991 |
Nyerges |
6 |
||||||||
|
1991 |
Wexelblat |
6 |
||||||||
|
1992 |
Bennett & Flach |
6 |
8 |
|||||||
|
1993 |
Price et. al. |
7 |
||||||||
|
1993 |
van der Waarde |
2 |
||||||||
|
1994 |
Roth et al. |
1 |
4 |
|||||||
|
1995 |
Bullimore et. al. |
8 |
||||||||
|
1995 |
Cox & Brna |
8 |
||||||||
|
1995 |
MacEachren |
6 |
||||||||
|
1995 |
Newsham |
1 |
||||||||
|
1996 |
Cheng |
6 |
||||||||
|
1996 |
Chuah & Roth |
7 |
||||||||
|
1996 |
Engelhardt |
4 |
||||||||
|
1996 |
Green & Petre |
7 |
||||||||
|
1996 |
Ittelson |
1 |
2 |
9 |
||||||
|
1996 |
Kress & van Leeuwen |
9 |
||||||||
|
1996 |
Scaife & Rogers |
8 |
||||||||
|
1997 |
Blackwell |
8 |
||||||||
|
1997 |
Strothotte |
2 |
||||||||
|
1997 |
Tversky |
5 |
6 |
9 |
||||||
|
1997 |
Tweedie |
7 |
||||||||
|
1997 |
Zhang |
8 |
||||||||
|
1998 |
Green & Blackwell |
7 |
||||||||
|
1998 |
Marriott & Meyer |
7 |
||||||||
|
1999 |
Card et al. |
1 |
4 |
6 |
7 |
8 |
||||
|
1999 |
Elkins |
4 |
5 |
|||||||
|
1999 |
Horn |
2 |
4 |
|||||||
|
Vocab |
Conv |
Abstr |
Struc |
Corr |
Inform |
Ta&In |
Cogni |
Social |
||
Figure 3 is a chronological listing of the taxonomies that we have examined. For each taxonomy show which of the nine aspects it analyses. The chart can be used in two main ways. One way of using it is to look for researchers that have analysed a specific aspect. The other way of using it is to compare whether specific taxonomies analyse the same aspect(s) or not.
This section summarises research interests and objectives of the different academic fields that were identified as the basis for our meta-taxonomy in the introduction to this chapter.
How do different diagram types and diagram features affect human problem solving? It is obvious that a wide range of cognitive tasks is involved in constructing and interpreting diagrams, but we are not necessarily able to enumerate them or characterise them. If we could do so, we would be able to propose ways to make the use of diagrams faster, more accurate or easier to learn. These applied objectives have further scientific implications, however. Investigating the use of diagrams can teach us about the nature of cognition; this is central to the traditional concerns of cognitive psychology with perception, memory and problem solving.
Cognitive science is already focused on definite descriptions of diagrammatic reasoning tasks. As with all cognitive science, the use of computer models allows researchers to propose and investigate systematic (and potentially formalisable) models of reasoning. A primary focus of research into reasoning with diagrammatic representations is to investigate how these models can accommodate analog representations rather than symbolic logic. Cognitive scientists carry out formal analyses of these different types of representations, but are also concerned with the nature of "internal representations" in human reasoning -- the long standing debate over mental imagery, for example, is regularly informed by research into diagrams. A further product of cognitive science research is that of artificial intelligence -- what can we discover about computational questions or engineering solutions by building computer systems that use analogue representations?
How can the syntax, semantics, and pragmatics of diagrams be analysed? Modern critical theory has given us all a passing familiarity with this linguistic trichotomy; this is evident from the similarities between the taxonomies that we compared. Computational linguistics is concerned with properties of diagrams that enable research analogous to the research on verbal language. How can we formulate grammars that will allow automatic parsing and generation of diagrams? How can we write and test those grammars, or use them to analyse the structure of discourse? Situational semantics considers communication in a context that includes artefacts such as diagrams, and allows statements to be made about the informational status of the whole situation. How can we apply theories of conversational implicature to diagrams? What does the viewer expect a diagram to mean, and how can the producer exploit that expectation?
Diagrams have held promise as a means of programming computers for many years. The objective is egalitarian -- will diagrams make programming accessible to more people? This may be social -- encouraging communication between programmers and their managers; educational -- providing notations usable by children; or democratising -- making programming accessible to novices rather than experts. How can these be achieved? Early work was unreasonably optimistic about the value of diagrams, and much research is now focused on using Green's cognitive dimensions of notations to assess suitability for different tasks. Educational use of visual programming implies that skills learned from diagrams can be transferred to other notations -- is this true? We need to understand what the user is learning -- is it a virtual machine, mathematical properties of an algorithm, or just execution statistics? Finally, the traditional concerns of computer science intersect with these properties of diagrams. How can they be parsed and executed efficiently, and will they "scale up" to large and complex problems?
Most published diagrams are created by a person with a communicative intent and an understanding of the expected reader. How can data be characterised and design rules formalised in order to automate the creation of visual representations? This might involve choosing an appropriate interpretation of higher-dimensional data in two or three dimensions -- if three, how can we deal with the occlusion problem on a visual display screen? How can such a system choose to allocate dimensions to isomorphic representation of physical spaces rather than symbolic information? What is the space of possible visual interactions between the user and the machine? Will we facilitate deeper understanding by making diagrams interactive or immersive? In all of these considerations, we need to know how the choice of an appropriate visualisation depends on the user's information seeking goals.
The task of a graphic designer is to start with some set of information, and prepare a way of communicating that information effectively. In order to do this, they must have access to some set of possible design solutions. How can this set be systematised? What is the visual vocabulary available to the designer? These are the topics of research in graphic design. The visual vocabulary must be extended by a "space" of possible spatial organisation (set-up, lay-out) for a given design problem. Graphic design also takes place within a social context: how does the genre (instructions, signage, newspaper graphics, textbook illustration, forms, etc.) affect design decisions beyond the simple limitations of media type and the vagaries of graphical fashion?
Which types of diagrams are appropriate for what teaching goals? The field of education considers two separate questions: first, the need to educate children to be graphically "literate". What are the requirements of graphical literacy, how can it be assessed, and at what age should it be taught? Does it belong within a specific subject (e.g. mathematics), or should it span the curriculum? The second objective in education research is to understand how use of diagrams can facilitate education in all subjects. When and how and to what extent should we use diagrams in a textbook or a classroom presentation? Are they likely to enliven dull material, or will students ignore them as overly technical? If school material is learned diagrammatically, might this inhibit the development of abstract thought?
Scientific discovery has often been associated with novel uses of representations. Some of these involve representations that are now widespread, such as algebra or Cartesian coordinates, while others were completely personal (Einstein's thought-experiments, or Kekule's insight into the structure of the benzene ring). Are representations essential to science? Classicists such as Reviel Netz are doing "cognitive history" by investigating the diagrams on which past discoveries have been founded. The narratives of creative discovery from scientists bear great resemblance to architectural theories of creative sketching. Is such creativity restricted to intellectual giants, or can ordinary people exploit these diagrammatic strategies in the course of problem-solving?
Architects spend much of their time interacting with visual representations. Some of these are described by the architects themselves as diagrams, although their most common representation is the sketch. The uses of sketches are closely related to the uses of diagrams, however. How can a broader definition of diagram types support architectural problem solving? Are there some representations which constrain the possible design solutions? This is an issue of major concern whenever architects use computer aided design tools. Alternatively, what sort of diagrams facilitate the creativity that architects experience when sketching? Research into architectural sketching provides a radically different perspective on the cognitive function of diagrams -- one that has also been discovered in studies of software engineers.
Maps are seldom classed as diagrams in common usages of the term, but they share many of the interesting characteristics that have been covered in the taxonomies here. Furthermore maps are among the oldest visual representations that confronted the need to stylise and schematise from visual observations. Modern cartographic analysis also emphasises very challenging issues of social context, such as the implicit representation of political power in choice of representational conventions. It is very likely that these issues will eventually be noted as equally relevant in other areas of diagram use.
Although we are aware that researchers in decision support are interested in many of the issues raised here, neither of us feel sufficiently qualified to make any statements about their research objectives. We have therefore noted the existence of this topic, but will consider it no further here.
Several other researchers have proposed classifications of existing diagram-related taxonomies. A common distinction (Rankin 1990, Lohse 1994) is between functional taxonomies and structural taxonomies. Functional taxonomies involve our aspects 'task and interaction' (7), and 'social context' (9). Structural taxonomies involve our aspects 'basic graphic vocabulary' (1) and 'graphic structure' (4). However, some of the aspects discussed in this paper, like 'cognitive processes' (8) and 'mode of correspondence' (5), fall outside the functional/structural distinction.
Goldsmith's (1984) work is similar to ours in the sense that she is also trying to create a high-level reference frame for positioning and discussing existing research on visual representation. However, her work is quite different to ours in the sense that the existing research that she is looking at is not about diagrammatic representations and their use, but about depictive illustration, including issues of object identification and perception of pictorial depth. The aspects that she examines are geared towards those issues. In addition, the existing research work that she is studying and structuring is not taxonomic in nature, as in our case, but empirical.
Narayanan (1997) offers a taxonomy of the research that has been conducted into diagrammatic communication. His taxonomy of diagram research includes a review of previous taxonomies. Narayanan proposes a detailed theoretical definition of diagrammaticity (a more recent theoretical discussion of definition can be found in Shimojima (1999)), and summarises Bertin (1981), Goodman (1969), Lohse (1994), Engelhardt et. al. (1996), and many others. Narayanan's review of psychological research is particularly valuable, and provides a coherent taxonomy of mental representation, perceptual and interaction processes.
So far we have not mentioned Lohse et. al. (1994), who have produced a widely cited taxonomy of visual representations. This taxonomy is not based on an academic analysis of the representations themselves, but on similarity- and other assessments made by experimental subjects for a sample of typical visual representations. This is a valuable exercise, but it is not a substitute for principled analysis. If anything, the whole project falls within our aspect of social context -- it was a study of people's attitudes toward representations rather than their intrinsic characteristics.
In our survey, it is obvious that the majority of the taxonomies developed so far in diagram research concern our representation-related aspects. These aspects regard formalisable structure, and the attributes of diagrams that are most apparent by inspection. The representation-related aspects also fit most easily within the framework of semiotics, although semiotics does also include pragmatic context. Our characterisation of outstanding research issues, however, is generally grouped toward the later aspects. These aspects concern questions of performance, interpretation and cognition.
The reasons why taxonomies have tended to ignore these later issues is also clear -- they are less easily formalised. We must ask ourselves, though, whether this neglect is either desirable or necessary. As Ittelson points out, diagrams have no meaning without an interpreter and a communicative intent. There are many academic disciplines which quite reasonably give separate consideration to those questions more amenable to formal analysis. Contextual issues require different research methods, even different academic disciplines.
An interdisciplinary science of thinking with diagrams cannot afford to concentrate only on formal analyses without context. A lack of context-related approaches is evident from our inventory of taxonomies. While the meta-taxonomic framework that we have proposed here is certainly still work-in-progress, we do hope that it can provide a reference frame for the future development of diagram-related taxonomies.
We would like to thank Remko Scha, Karel van der Waarde, Ingrid von Engelhardt, Matthias Mayer, Alexander Klippel, Peter van Emde Boas, Theo Janssen, and Alan Swanson for their helpful comments on earlier drafts of this paper. Alan Blackwell's research is funded by the Engineering and Physical Sciences Research Council.
Arnheim, R. (1969). Visual thinking. University of California Press.
Barnard, P. and Marcel, T. (1978). Representation and understanding in the use of symbols and pictograms. In R. Easterby and H. Zwaga (Eds.), Information Design. Chichester: John Wiley and Sons, pp. 37-75.
Barthes, R. (1965). Elements de semiologie. Translated by A. Lavers and C. Smith, Elements of semiology. New York: Hill and Wang (1975).
Bennett, K.B. and Flach, J.M. (1992). Graphical displays: Implications for divided attention, focused attention and problem solving. Human Factors, 34(5), 513-533.
Bertin, J. (1967). Semiologie graphique: les diagrammes, les reseaux, les cartes. The Hague, Paris: Mouton and Gauthiers-Villars.
Bertin, J. (1977). La graphique et le traitement graphique de l'information. Paris: Flammarion.
Blackwell, A.F. (1997). Diagrams about thinking about thinking about diagrams. In M. Anderson (Ed.), Reasoning with Diagrammatic Representations II: Papers from the AAAI 1997 Fall Symposium. Technical Report FS-97-02. Menlo Park (CA): AAAI Press, pp. 77-84.
Bowman, W.J. (1968). Graphic Communication. New York: John Wiley.
Bullimore, M.A., Howarth, P.A. and Fulton, E.J. (1995). Assessment of visual performance. In J.R. Wilson and E.N. Corlett (Eds.) Evaluation of human work (2nd Edition). London: Taylor and Francis, pp. 804-839.
Card, S., and Mackinlay, J., Shneiderman, B. (1999). Readings in information visualization: Using vision to think. San Francisco: Morgan Kaufmann, pp. 1-34.
Cheng, P.C.-H. (1996). Functional roles for the cognitive analysis of diagrams in problem solving. Proceedings of 18th Annual Conference of the Cognitiv Science Society. Hillsdale, NJ: Lawrence Erlbaum, pp. 207-212.
Chuah, M.C., and Roth, S.F. (1996). On the Semantics of Interactive Visualizations, Proceedings of Information Visualization, IEEE, San Francisco, October 1996, pp. 29-36.
Cox, R. and Brna, P. (1995). Supporting the use of external representations in problem solving: the need for flexible learning environments. Journal of Artificial Intelligence in Education, 6(2), pp. 239-302.
Dale, E. (1969). Audiovisual methods in teaching (3rd edition). New York, Holt, Rhinehart and Winston.
Doblin, J. (1980). A structure for nontextual communications. In P.A. Kolers, M.E. Wrolstad and H. Bouma (Eds.), Processing of Visible Language 2. New York: Plenum Press, pp. 89-111.
Eco, U. (1985). Producing signs. In M. Blonsky (Ed.), On Signs. Baltimore: John Hopkins University Press, pp. 176-183.
Elkins, J. (1999). The domain of images. Ithaca, NY: Cornell University Press.
Engelhardt, Y. (1998). Meaningful space: How graphics use space to convey information. Proceedings Vision Plus 4, School of Design, Carnegie Mellon University, Pittsburgh, pp. 108-126.
Engelhardt, Y., Bruin, J., Janssen, T. and Scha, R. (1996). In N.H. Narayanan and J. Damski (Eds.) Proc. AID '96 Workshop on Visual Representation, Reasoning and Interaction in Design, Key Centre for Design Computing, University of Sydney.
Garland, K. (1979). Some general characteristics present in diagrams denoting activity, event and relationship. Information Design Journal, 1(1), 15-22.
Goldsmith, E. (1984). Research into illustration: An approach and a review. Cambridge: Cambridge University Press.
Goodman, N. (1969). Languages of art: An approach to a theory of symbols. London: Oxford University Press.
Green T.R.G. and Petre M. (1996). Usability analysis of visual programming environments: a 'cognitive dimensions' approach. Journal of Visual Languages and Computing 7, 131-174.
Green, T.R.G. and Blackwell, A.F. (1998). Design for usability using Cognitive Dimensions. Invited tutorial at BCS HCI'98.
Hardin, P. (1981). Representational characteristics in diagrams of statements of relationships. Unpublished PhD thesis, University of Iowa, UM 812 8401.
Harrison, R.P. (1964). Pictic analysis: Toward a vocabulary and syntax for the pictorial code; with research on facial expression. Unpublished PhD thesis, Michigan State University.
Horn, R.E. (1999). Visual language: Global communication for the 21st century. Bainbridge Island, Washington: MacroVU, Inc.
Ittelson, W.H. (1996). Visual perception of markings. Psychonomic Bulletin and Review 3, 171-187.
Kandinsky, W. (1921). Fundamental elements of painting [in Russian]. In a report to the People's Commissariat for Public Education, Moscow. English translation published in Languages in Design 1 (3, 1993), 267-271.
Karsten, K.G. (1923). Charts and graphs. New York: Prentice-Hall.
Kepes, G. (1944). The language of vision. Chicago: Theobald.
Knowlton, J.Q. (1966). On the definition of "picture''. AV Communication Review, 14, 157-183.
Krampen, M. (1965). Signs and symbols in graphic communication. Design Quarterly, 62, 1-31.
Kress, G. and van Leeuwen, T. (1996). Reading images: The grammar of visual design. London: Routledge.
Larkin, J.H. and Simon, H.A. (1987). Why a diagram is (sometimes) worth ten thousand words. Cognitive Science 11, 65-99.
Lohse, G.L., Biolisi, K., Walker, N., Rueter, H.H. (1994). A classification of visual representations. Communications of the ACM, 37(12), 36-49.
MacEachren, A. M. (1995). How maps work: Representation, visualization, and design. The Guilford Press.
Macdonald-Ross, M. (1977). Graphics in texts. In L.S. Shulman (Ed.), Review of research in education, Vol. 5, Itasca, Ill.: Peacock.
Mackinlay, J. (1986). Automating the design of graphical presentations of relational information. ACM Transactions on Graphics, 5(2), 110-141.
Marriott, K. and Meyer, B. (1998). The CCMG visual language hierarchy. In K. Marriott and B. Meyer (Eds.) Visual Language Theory. Springer, pp. 129-170.
Martin, J. and McClure, C. (1985). Diagramming techniques for analysts and programmers. Englewood Cliffs, NJ: Prentice-Hall.
Narayanan, N.H. (1997). Diagrammatic communication: A taxonomic overview. In N. Kokinov (Ed.), Perspectives on Cognitive Science, Vol. 3, Sofia: New Bulgarian University Press.
Newsham, R. (1995). Symbolic representation in object-oriented methodologies: Modeling the essence of the computer system. Unpublished Master's thesis, Department of Computer Science, Nottingham Trent University.
Nyerges, T.L. (1991a). Geographic information abstractions: Conceptual clarity for geographic modeling. Environment and Planning A, 23, 1483-1499.
Nyerges, T.L. (1991b). Representing geographical meaning. In B.P. Buttenfield and R.B. McMaster (Eds.), Map generalization: Making rules for knowledge representation. Essex, UK: Longman, pp. 59-85.
Owen, C.L. (1986). Technology, literacy, and graphic systems. In M.E. Wrolstad and D.F. Fisher (Eds.), Towards a new understanding of Literacy. Proceedings of the third conference on Processing of visual language, held May 31 through June 3, 1982, at Airlie House, Airlie, Viginia.
Peirce, C.S. (written around 1897, republished in 1932). Elements of Logic. In C. Hartshorne and P. Weiss (Eds.), The collected papers of C.S. Peirce. Harvard University Press.
Price, B.A., Baecker, R.M. and Small, I.S. (1993). A principled taxonomy of software visualization. Journal of Visual Languages and Computing, 4(3), 211-266.
Rankin, R. (1990). A taxonomy of graph types. Information Design Journal, 6(2), 147-159.
Richards, C.J. (1984). Diagrammatics. Ph.D. thesis, Royal College of Art, London.
Roth, S.F. and Mattis, J. (1990). Data characterization for intelligent graphics presentation. Proceedings of the Conference on human factors in computing systems (SIGCHI '90), Seattle, WA, April 1990, pp. 193-200.
Roth, S.F., Kolojejchick, J., Mattis, J., and Goldstein, J. (1994). Interactive graphic design using automatic presentation knowledge. Proceedings of the CHI'94 Conference on human factors in computing systems. New York: ACM, pp. 112-117.
Saint-Martin, F. (1987). Semiotics of visual language. Bloomington, Ind.: Indiana University Press.
Sampson, G. (1985). Writing systems: A linguistic introduction. London: Hutchinson.
Scaife, M. and Rogers, Y. (1996). External cognition: how do graphical representations work? International Journal of Human Computer Studies, 45, 185-214.
Shimojima, A. (1999). The graphic-linguistic distinction -- exploring alternatives. Artificial Intelligence Review, 13, 313-335.
Stewart, A. H. (1976). Graphic representation of models in linguistic theory. Bloomington: Indiana University Press.
Strothotte, C. and Strothotte, T. (1997). Seeing between the pixels. Springer Verlag.
Tversky, B. (1997). Cognitive principles of graphic displays. In M. Anderson (Ed.), Reasoning with Diagrammatic Representations II: Papers from the AAAI 1997 Fall Symposium. Technical Report FS-97-02. AAAI Press, Menlo Park (CA), pp. 116-124.
Tweedie, L. (1997). Characterizing interactive externalizations. Proceedings of the CHI'97 Conference on human factors in computing systems. ACM, pp. 375-382.
Twyman, M. (1979). A schema for the study of graphic language. In P.A. Kolers, M.E. Wrolstad, H. Bouma (Eds.), Processing of visible language. Vol. 1. New York: Plenum Press, pp. 117-150.
van der Waarde, K. (1993). An investigation into the suitability of the graphic presentation of patient package inserts. Unpublished PhD thesis, Department of Typography and Graphic Communication, University of Reading, UK.
Wehrend, R. and Lewis, C. (1990). A problem-oriented classification of visualization techniques. In Proceedings of the first IEEE Conference on Visualization: Visualization 90, pp. 139-143. IEEE, Los Alamitos, CA, October 1990.
Werner, H. and Kaplan, B. (1963). Symbol formation: An organismic-developmental approach to language and the expression of thought. New York: John Wiley.
Winn, W. (1989). The design and use of instructional graphics. In H. Mandl and J.R. Levin (Eds.), Knowledge acquisition from text and pictures. North Holland: Elsevier Science Publishers.
Wexelblat, A. (1991). Giving meaning to place: semantic spaces. In M. Benedikt (Ed.), Cyberspace: first steps. MIT Press, pp. 255-271.
Wood, D. and Fels, J. (1986). Designs on signs: Myth and meaning in maps. Cartographica 23, 54-103.
Wurman, R.S (1991). Information Anxiety. New York: Doubleday.
Zhang, J. (1997). The nature of external representations in problem solving. Cognitive Science 21, 179-217.
 Blackwell's home
page.
Blackwell's home
page.