
Extract from Blackwell, A.F. (1998).
Metaphor in Diagrams
Unpublished PhD Thesis, University of Cambridge.
The giving form and shape, to what otherwise would only have been an abstract idea, has, in many cases, been attended with much advantage.
The Commercial and Political Atlas W. Playfair, 1801, p. xi.
The experiments reported in this chapter test the fundamental claim of the user interface metaphor, and one of the underlying assumptions of visual programming language advocates - that novel abstract concepts can be presented diagrammatically in terms of familiar physical experience. In the context of building user interfaces, it may be reasonable to claim that an interactive diagram imitates what Gibson (1979) called the perceptual affordances of the physical world. As in the physical world, graphical affordances indicate potential actions within the interface (Norman 1988, Larkin 1989). Affordances do not require explicit metaphor (Mohnkern 1997a), and may even fail if metaphors are drawn too far from their source domain (Lewis 1991). Theories of user interface affordances have often been conflated with the role of visual structure in forming analogies. This role was demonstrated in a more general investigation by Beveridge and Parkins (1987), showing that analogical solutions are more easily discovered when their structure is presented visually - but those findings have not been tested in user interface applications.
Many theories of diagrammatic reasoning claim, however, that knowledge of the physical world is used to interpret diagrams even when they do not support interaction. These are often related to theories of conceptual metaphor and thematic relations claiming that all abstractions, even linguistic ones, are derived from embodied experience (Jackendoff 1983, Johnson 1987, Lakoff 1987). Conceptual metaphor theories attract considerable debate, with theoretical and experimental evidence both for (Gibbs & O'Brien 1990, Gibbs 1996, De Vega, Rodrigo & Zimmer 1996) and against (Murphy 1996, 1997, McGlone 1996, Rumelhart 1993). Spatial representations are equally contentious when proposed as a cognitive basis for grammar (proposed by Talmy 1983, but challenged by Choi & Bowerman 1991) or for memory (proposed by Glenberg 1997, and sure to be challenged soon). Despite the disputed status of conceptual metaphor theories, HCI researchers such as Tauber (1987) and Hutchins (1989) argue that user interfaces similarly reflect spatial representations of abstract structure. Gattis & Holyoak (1996) make the same argument regarding the interpretation of Cartesian graphs. Lakoff (1993) has also extended his observations on the linguistic consequences of spatial experience to encompass the use of diagrams to express abstraction.
The experiments reported in this chapter address these claims by testing whether spatial representations, when used in the context of visual programming, do facilitate abstract problem-solving. Surveys 1 and 3 discovered a range of beliefs that appear similar in some ways to the claims about conceptual metaphor. In fact, programming is a far more complex activity than those that are used in typical metaphor experiments. Writing a computer program is a loosely constrained problem solving exercise rather than being like generation of natural language (Green 1980, Green, Bellamy & Parker 1987, Visser 1992, Koenemann & Robertson 1991). Many studies of problem solving have demonstrated the potential for using one or more external representations as a cognitive tool (Katona 1940, Schwartz 1971, Carroll, Thomas & Malhotra 1980, Anderson 1996, Cox 1997, Zhang 1997). In solving programming problems, the language acts both as the solution medium and the problem solving representation. A visual programming language must therefore be effective as a diagrammatic tool for problem solving.
The two experiments in this chapter compare the effect of metaphor in the representation to the effect of programming expertise. Many studies have observed that expertise in using a specific notation has a significant effect on both problem-solving strategies and performance, in fields including not only programming (Adelson 1981, McKeithen et. al. 1981) but electronic circuit design (Egan & Schwartz 1979, Petre & Green 1993), meteorology (Lowe 1993b), abacus use (Hishitani 1990) and blindfold chess (Saariluoma & Kalakoski 1997).
Visual programming languages, however, are not primarily designed for use by expert programmers. Graphical representations are expected to be more appropriate for inexperienced computer users (van der Veer, van Beek & Cruts 1987, Sohn & Doane 1997), and the value of visual programming languages for inexperienced users has been demonstrated in studies by Cunniff & Taylor (1987) and Mendelsohn, Green & Brna (1990), as well as being an explicit claim when programming languages are promoted for use by novices without any empirical verification (di Sessa 1986, Bonar & Liffick 1990). Nardi (1993) on the other hand, has strongly criticised the notion of any programming language being suitable for novices or "end-users".
The experiments reported here have used participants without programming experience partly in order to separate the issue of notational expertise from the effect of metaphor in learning to use a notation. They also compare experts and novices. Experienced programmers have knowledge about programming that is independent of the representation being used as noted by Mayer (1988), and they apply consistent strategies for code comprehension even when using a language that does not explicitly reveal their preferred structures (Boehm-Davis, Fox & Philips 1996). The design of these experiments is based on the premise that expert programmers will out-perform novices, even using a notation they have not seen before, and that the degree of this performance difference will provide a reference scale for the degree by which metaphor improves the performance of novices in the same task.
Despite surface similarities, the process of learning a programming language has little in common with learning a natural language. Inappropriate generalisations from natural language are a major source of confusion to programming novices. Bonar and Soloway (1985) report that novice bugs found in think-aloud protocols often result from generalisations of natural language, while Scapin (1981) found that novices make more errors when using a text editing command set derived from natural language than when using more "computational" terminology. The use of metaphor in a computer language is also unlike the use of metaphor to extend the expressive potential of natural languages (Gentner & Clement 1988). Natural language tropes such as metaphor rely on the potential for ambiguity in language (Empson 1984), while computer languages are designed to be unambiguous (Green 1980, Cohen 1993). Gentner, Falkenhainer & Skorstad (1988), in describing their structural model of metaphor interpretation, warn explicitly that the interpretation of user interface "metaphors" involves a different process to the interpretation of linguistic metaphors.
In what sense, then, can programming languages be metaphorical? The metaphor that is addressed in this experiment is an explanatory metaphor by which those learning to use the programming language understand its operation. Users of any device form a mental model of its behaviour, explaining why it responds as it does to their actions. This is true of complex machinery (Moray 1990), pocket calculators (Young 1981, 1983), computer operating systems (Tauber 1987) and automatic teller machines (Payne 1991). The mental model is sufficiently detailed to explain the observed behaviour, but does not describe all the details of the device's design (du Boulay, O'Shea & Monk 1981).
In computer science terminology, the model that defines the behaviour of a programming language is a "virtual machine". Cognitive ergonomics (van der Veer 1990) and program understanding (Tenenberg 1996) depend on whether the user's mental model is consistent with the virtual machine. Programming languages for use by novices have therefore attempted to make the virtual machine more explicit (e.g. Esteban, Chatty & Palanque 1995) perhaps most originally in the form of cartoon characters acting in a computational town of function houses and message-carrying birds (Kahn 1996). If novice programmers are not explicitly given a virtual machine, they create their own metaphors to explain the behaviour of the language (Jones 1984). Even in languages which supposedly describe computation in purely mathematical terms, novices want to know how functions will be evaluated (Segal & Schuman 1992). If novices are not given a model of a virtual machine, they may invent an inappropriate explanation (Booth 1992, Eisenberg, Resnick & Turbak 1987, Eisenstadt, Breuker & Evertsz 1984), working from sources of information such as observing a debugger (Ca�as, Bajo & Gonsalvo 1994) extrapolating from tutorial code examples (Noble 1992), or imagining the behaviour of the machine from the viewpoint of an internal agent (Watt 1998).
Programming languages must therefore serve a dual purpose: a notation for solving a problem in some problem domain, as well as representation of some virtual machine (Taylor 1990, Blackwell 1996a). Their effectiveness depends on how well information can be mapped from the problem domain to the notation, and from the notation to the virtual machine (Payne, Squibb & Howes 1990, Norman 1991). The structure of the virtual machine, and the nature of the mapping, combine to form what is often called the "programming paradigm" - families of languages that support the same programming techniques. Overly complex mappings can easily compromise performance (Nardi & Zarmer 1993), but one of the main challenges in improving programming language usability is providing metaphors that are appropriate for the user (Carroll & Olson 1988, Pane & Myers 1996, Pane 1997). Visual programming languages can potentially achieve this goal by depicting the virtual machine as if it were a physical machine (Glinert 1990) which can be understood by analogy from the user's experience of real world machines (Tauber 1987, Treglown 1994).
Metaphors of the virtual machine have been used for some time when teaching programming as well as other aspects of computer use: the effectiveness of metaphor has been demonstrated experimentally when learning programming languages (Mayer 1975), command languages (Payne 1988) and system behaviour (van der Veer 1990). Chee (1993) has proposed a theory of analogical mapping from metaphor to programming language. When the metaphor is incorporated into the language as a pictorial diagram, however, it is constantly available for inspection, unlike the situations in which mental models and virtual machines are conjectural cognitive structures. For a visual programming language, the programming paradigm and the user interface metaphor should ideally become indistinguishable.
The way that this type of metaphor is interpreted may involve very different cognitive processes from those used in interpreting textual programming languages. Diagrammatic representations of physical machines are often interpreted via a process of mental animation. Hegarty (1992) used this term to describe experiments in which the gaze of subjects reasoning about the motion of pulleys in a mechanical diagram followed the imagined direction of motion. Similar results have been reported by Fallside and Just (1994), Narayanan, Suwa and Motoda (1995) and Sims and Hegarty (1997). Schwartz has shown that making a visual representation of a mechanism more or less pictorial can influence the choice of a mental animation strategy (Schwartz 1995, Schwartz & Black 1996a). In his experiments, subjects asked to assess lengths on either side of a hinged joint appeared to mentally rotate the joint into place if it was presented pictorially, but used an analytic strategy (with reaction time consequently independent of joint angle) when the pictorial detail was removed.
In the experiment presented here, two forms of a visual programming notation are used. Both express a virtual machine, and both express it diagrammatically. One of them, however, depicts the virtual machine as a metaphorical physical machine, as recommended in many of the publications cited above for teaching programming or assisting novice programmers. It uses cartoon-like representations of physical machines, intended to produce mental models corresponding closely to the virtual machine. It is also intended to encourage reasoning about program behaviour using mental animation strategies of the kind described by Schwartz (1995) and Hegarty (1992).
The diagrammatic notation used in this experiment was based on the most common paradigm for visual programming languages. In a "data flow" language, computational operations are represented by nodes in a graph. The arcs between these nodes indicate potential transfer of data between different operations. The overall behaviour of the program is defined by the topology of the graph. Data flow languages are considered to be particularly appropriate for describing concurrent computation (Finkel 1996), but the claim that they provide advantages to any particular class of user by assisting comprehension, problem-solving or program design is still under investigation (Karsai 1995, Good 1996).
Figure 4.1. Example of LabVIEW program
Figure 4.2. Example of JavaStudio program
Dataflow is already considered particularly appropriate for exploitation in commercial visual programming languages, however. Two examples of commercially available visual programming languages employing dataflow are illustrated in figures 4.1 and 4.2. Both describe dataflow in a metaphorical way, although the metaphors are presented using different modes. The LabVIEW language, shown in figure 4.1, depicts the paths between nodes as simple lines (although these are coloured to indicate the type of data). The documentation for LabVIEW, however, describes these lines metaphorically as "wires" like those connecting components in an electronic circuit. The JavaStudio language, shown in figure 4.2, depicts paths as miniature pipes, including visible plumbing joints. The metaphor implicit here is that data flows from one component to another like a fluid through plumbing.
Figure 4.3. Comparison operations without and with metaphor
Two different presentation modes were also used in this experiment. In one of them, nodes were connected together using unadorned lines, and the nodes themselves were represented as abstract symbols. An example of one of these nodes, representing a comparison operation, is shown in figure 4.3a. The symbol provides some mnemonic assistance using mathematical conventions, but there is no explicit physical metaphor. In the second presentation mode, nodes were connected by tracks with balls rolling along them. The nodes themselves were fanciful "Heath Robinson" mechanisms showing a computational function implemented by controlling the motion of balls, as in the proposed ball-bearing computer described by Pilton (1971). A comparison operation, in which an arriving ball is weighed against a predefined value to determine the outcome, is shown in figure 4.3b.
Figure 4.4. Examples of computational operations
These two versions of the dataflow notation, one depicting dataflow metaphorically as the motion of balls, and the other using a relatively simple geometric depiction, were otherwise made as similar as possible. The component nodes and connections between them were given to participants in the form of paper cut-outs, whose profiles were identical in each version. Figure 4.4 shows a selection of computational operations, comparing the two versions of each (the full set of components is reproduced in Appendix B.1). Participants arranged these cut-outs on a tabletop by matching the convex data outputs on the right hand side of node and path profiles to the concave data inputs on the left hand side of another node or path. Figure 4.5 shows an example of a complete program (using the metaphorical notation) which would simply display the numbers from 1 to 10.
Figure 4.5. Example program: display numbers from 1 to 10
The task domain used in this experiment was intended to be equally familiar to programmers and non-programmers. Following the advice of Lave (1988), I designed four tasks based on a regular household task - the inspection of bank statements. Participants were asked to interpret or write programs that would carry out the following functions:
A transcript of the instructions and task specifications is included in Appendix B.1.
Although the tasks were performed using paper cut-outs rather than a computer editing environment, the table top was arranged in a way that resembled typical visual programming languages. Figure 4.6 shows trays at the right hand side of the table, made to resemble a software "palette". The trays were divided into compartments, each containing a pile of one type of component.
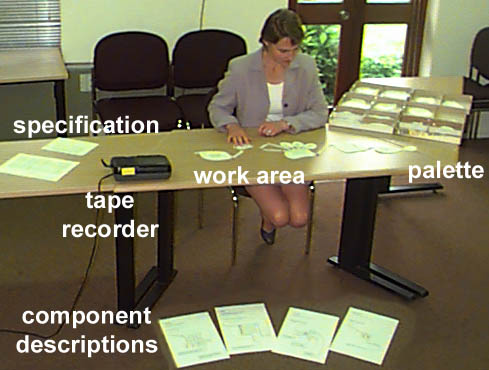
Figure 4.6. Experiment 1 working environment
The behaviour of each component was described on individual printed pages. When using a component for the first time, participants were given one of these descriptions to read, but it was then placed out of view of the participant, who could ask to see it again at any time. This was intended to be similar to the operation of an on-line help facility.
Participants were also given a mock-up of a bank statement to be used for reference during the bank statement processing tasks.
Twelve participants were recruited from volunteers registered with the Applied Psychology Unit Subject Panel, and from amongst staff at the Unit. They were divided into two groups on the basis of their prior experience of computer programming. Four participants had previously worked as professional programmers; eight had never written a computer program ("novices"). The second group were broadly matched in educational achievement and intelligence to the experienced programmers (they were educated to degree level, and during previous experiments at the APU, their scores on Cattell's Culture Fair test had corresponded to an IQ of between 120 and 140).
The second independent variable was the version of the data flow notation given to the participant, either with or without the rolling ball metaphor. Assignment was balanced within each experience group: I presented each version of the notation to four non-programmers, and to two of the programmers. I made this allocation in the expectation that the metaphor would bring novice performance closer to that of the expert programmers, whereas it would have little effect on the experts. If this were the case, the expert programmers could be aggregated into a single group for analysis, and the performance of this group would provide a point of reference for the claim that metaphor can improve the performance of novices with respect to experts.
Performance was measured using two dependent variables. The first was the total time that the participant took to complete each of the four activities described below. The second was the degree of elaboration that the participant produced in the two program construction tasks. The program specification that they were given allowed several different solutions, but complete solutions had similar degrees of complexity, while incomplete solutions omitted some of the required components. The relative quality of the solutions might be subject to interpretation, but the degree of completeness could be estimated by the simple measure of the number of nodes included. The third dependent variable was the number of times that participants asked to review component explanations after they had initially read them.
Three further dependent variables were used to measure awareness of the metaphor. A think-aloud protocol was recorded while the participant worked on each task. I compared the vocabulary of these protocols in order to identify the frequency with which the participant referred to the problem domain, to the computational metaphor, and to abstract mathematical or computational terms. These were compared using three different vocabulary classifications: nouns were classified according to the domain they referred to, verbs were divided into physical and abstract behaviour, and descriptions of flow were classified into references to the virtual machine and references to the problem domain.
The first two hypotheses were assessed on the basis of the time and elaboration performance measures, comparing performance of novices to that of experts, and also comparing performance with and without diagrammatic metaphor. The effect of the metaphor on learning was evaluated in terms of the number of review requests made by participants. Vocabulary in the think-aloud protocols was used to evaluate the extent to which participants used the metaphor when reasoning about the program.
Before the start of the experiment, I instructed participants in the procedure for "thinking aloud" during problem solving, using the instructional procedure prescribed by Ericsson and Simon (1993). As the participant performed each task, the tape recorder seen in Figure 4.6 recorded this verbal protocol. In order to confirm the assumption of task domain familiarity, I asked all participants to confirm that they were familiar with bank statements.
For the first task, I demonstrated the creation of a program to add total credits and debits, describing the operation of the program as each component was added. I read the description from a script that was identical in the two versions of the language (this script is included in appendix B.1). The participant was shown a description of each component as it was added to the program, which they read at their own pace. The layout of the component descriptions is shown in figure 4.7. Only the picture was changed in the two versions of the language - the description texts were identical (the full set of component descriptions is reproduced in Appendix B.1). After the program was complete, I shuffled the paper components, and asked the participant to reassemble to program while thinking aloud.
Figure 4.7. Layout of component descriptions
In the second task, I showed a completed program to the participant, printed to the same scale as the paper cut-outs on the tabletop. I told the participant that the program was designed to find missing cheque numbers in a sequence, and asked them to explain how it worked. The program contained an error (it compared each number to itself rather than to the previous one in the sequence), and I asked them to find this error and suggest a way of fixing it. This program included two more components that had not been used in the first task, and I described the function of these components in the same way as before.
In the third task, the participant was given a description of a program that would check the locations of cash withdrawals, and display any that had been made outside Cambridge. I then asked the participant to create a program that would carry out this function. As before, I described a further component that would be required in this task.
In the final task, the participant was given a description of a program that would find a cheque paid to a particular recipient, and automatically write another cheque for the same amount. I did not describe any new components, but told the participant that some new components would be required. When this occurred, they were to use "mystery components" that could be defined to carry out new operations, as when designing an encapsulated function in a real programming language.
Throughout the experiment, each component was described only once. Participants read at their own pace, but the description page was then placed beyond reading distance. They were able to review the description of any component by asking to see the page again, as in an online help facility.
The experimental hypotheses express the expected improvement in performance resulting from use of metaphor in terms of time taken to complete all the tasks, and elaboration in construction tasks. The effect of metaphor on these measures is considered with respect to the differences between novices and experts.
The four expert participants are considered as a single group in this analysis. I did not expect to find a large effect of metaphor on expert performance, and the experiment was intended to assess its utility for novices. Two of the four experts used the metaphorical version of the notation, and two used the geometric version. The performance measures for these groups were, as expected, similar - they are summarised in table 4.1. No significant differences were observed, but the size of the groups is too small to draw any further conclusions regarding the assumption of homogeneity.
| Performance measure | With metaphor | No metaphor |
| Time to complete four tasks (h:mm:ss) | 0:28:27 | 0:41:50 |
| Elaboration in construction tasks | 23.5 | 23.0 |
| Number of review requests | 5.0 | 6.5 |
Table 4.1. Performance measures within expert groups (N=2)
There were significant differences between the two novice groups and the expert group in the levels of performance observed. Novices took an average of 57 minutes to complete the four tasks, while the overall average in the expert group was 35 minutes, F(1,10)=6.07, p<.05. Experts also produced solutions that were more elaborate: 23.25 components on average, versus 18.13 for novices, F(1,10)=19.66, p<.01. The difference between the number of review requests made by novices and experts was not significant, for reasons discussed below.
| Performance measure | With metaphor | No metaphor |
| Time to complete four tasks (h:mm:ss) | 0:53:42 | 1:00:19 |
| Elaboration in construction tasks | 17.8 | 18.5 |
| Number of review requests | 7.0 | 17.0 |
Table 4.2. Performance measures within novice groups (N=4)
The main hypothesis in this experiment was that the novice group given the metaphorical version of the language would be intermediate in performance between novices with no metaphor and experts. The relative performance of the three groups is compared in figure 4.8. Although there is a significant difference between the expert and novice groups in task completion time, there is no significant difference between the two novice groups, F(1,6)=0.33, p=.586. The same is true of the elaboration measure, F(1,6)=0.57, p=.477.
Figure 4.8. Comparison of expert performance to novices with metaphor
The first hypothesis referred specifically to the effects of metaphor on learning, rather than on performance. There is an effect in the expected direction on the mean number of times that novices asked to review the component explanation (see table 4.2); the mean number of requests is much higher in the novice group with no metaphor. This difference is not statistically significant, however, F(1,6)=3.35, p=0.117. The large difference is in fact due to only two of the four participants in the no metaphor condition - the other two made review requests no more often than those in the metaphor condition. The effect of metaphor on learning is investigated with a larger sample of novice programmers in the next experiment, and in the experiments discussed in chapter 6, where it is found to be a significant source of variation.
In order to measure the extent to which the dataflow metaphor was used in reasoning about the notation, I compared the vocabulary used by novices in the verbal protocols. This involved three separate comparisons. The first two were comparisons of the categories of noun phrases and verbs found in the protocol transcripts. Noun phrases were divided into references to the virtual machine, references to the metaphor, references to the problem domain of bank statements and references to other material (material outside the scope of the experiment). Figure 4.9 shows the mean number of references made in each category by the three experimental groups. The most significant observation is that none of the participants in the metaphor group ever referred to the implicit metaphor while thinking aloud. Neither are there any other significant differences between novices in the metaphor and no-metaphor group. Experts do, however, make significantly more references than novices to the problem domain while thinking aloud, F(1,10)=12.12, p<.01.
Figure 4.9. Distribution of transcript noun phrase referents
In a second analysis of vocabulary, all verbs in the protocol transcripts were classified into categories comprising references to motion, propulsion, decision, alteration, expression, state change, observation, layout, arithmetic, ownership, mental process, and necessity. If participants were thinking of a virtual machine in terms influenced by the metaphor, they should be more likely to use verbs of motion or propulsion.
Most participants used a rather constrained vocabulary while thinking aloud, some of them using certain verbs continually. This resulted in a skewed distribution of category sizes between subjects, and of vocabulary within the categories. I therefore based this analysis on log transformed frequencies of verbs within each category, relative to the total number of verbs used by that participant. The log frequencies for each verb category are illustrated in figure 4.10. No significant differences were found between the metaphor and no-metaphor cases in these distributions.
Figure 4.10. Log frequency distribution of transcript verb categories
A third comparison of the verbal protocols concentrated specifically on occasions when participants described interaction between components. These were divided according to the type of information or entities that were described as moving between components: they could refer to program values (either control information or specific data), to entities in the problem domain (such as account numbers), or to abstract entities (such as "item", "value" etc.). The number of references that fell into each of these categories is shown in figure 4.11. There are no significant differences between the first two categories in the metaphor and no-metaphor conditions, but there is a large difference in the number of references that are made to abstract values moving between components, F(1,6)=12.07, p<.05.
Figure 4.11. Descriptions of interaction between components
The measures used in this experiment were successful in measuring different levels of performance - they clearly distinguished between the expert and novice groups. Despite the fact that the measures appear to be sufficiently sensitive, the expected improvement in performance when novices were given a metaphorical diagram was not observed. This is a new finding in HCI. Some previous experiments in HCI areas other than programming have failed to find improvements in performance when metaphors are introduced (e.g. Eberts & Bitianda 1993; Sutcliffe & Patel 1996), but those studies have generally suggested that specific usability problems reduced the benefits expected of an otherwise valuable interaction metaphor.
The design of this experiment did assume that expert programmer performance would be relatively consistent, whether or not they were given an explanatory metaphor. This expectation was derived from studies of expert programmers such as that of Scholtz & Wiedenbeck (1992), who observed that experts learning a new language used strategies already familiar to them, rather than learning how the features of the new language might require a different approach. A similar effect may, however, have resulted in the unexpected consistency in novice performance. Studies of novice programmers have observed that, while they cannot transfer strategic knowledge from other programming languages, they do transfer the structures of everyday tasks into the programming domain (Eisenstadt, Breuker & Evertsz 1984) and that this produces strategic preferences for procedural explanations even where a programming language (Prolog) encourages declarative explanations (Noble 1992). This type of strategic transfer may have reduced reliance on the metaphor in this experiment.
It is possible that novices simply ignored the illustrations, as their attention was never drawn to them explicitly. This behaviour has been observed in studies of illustration by Wright, Milroy and Lickorish (in press). It may be a sensible strategy for readers whose comprehension and reading speed would otherwise be reduced by the effort involved in integrating text and illustrations, as observed by Willows (1978) in studies of reading speed in children, and by Mayer and Sims (1994) in a comparison of students with high and low scores on spatial reasoning tests. Advice on illustrating educational material also recognises that some students are likely to follow a text without attending to illustrations (Dale 1969). Furthermore, several participants in this experiment commented that they found the illustrations unsympathetic (the experts, however, found them entertaining). This element of affect may have caused novices to give less attention to the illustrations. The problem of metaphors that users simply do not like has previously been noted in HCI by Halewood & Woodward (1993), and Pinkpank and Wandke have observed anxiety when users are asked to use interfaces that they expect to be difficult (1995). These effects may inhibit use of graphical metaphors in the same way that Hesse, Kauer and Spiers (1997) have noted reductions in analogical transfer when the source domain has negative emotional connotations.
Evidence taken from the verbal protocols in this experiment does suggest that novices may not have been aware of the metaphorical illustrations. Alternatively, participants may have reasoned about the motion of the metaphorical machines using mental animation strategies that are not accessible to verbalisation, as noted by Schwartz and Black (1996a). Lowe (1993b) makes a fundamental criticism of the use of verbal protocols in diagram experiments for this reason, although other researchers have defended their use in more general studies of HCI (Fisher 1987). The critiques of Schwartz and Black or Lowe are relatively benign, however. A more worrying possibility is that verbalisation altered performance by "overshadowing" insights that might otherwise have been derived from the visual material. Early studies in problem solving considered that verbalisation improved performance by forcing participants to think (e.g. Gagn� & Smith 1962, Berry 1990), but Schooler working with several colleagues has found that verbalisation impairs performance on non-verbal memory tasks (Schooler, Ohlsson & Brooks 1993, Brandimonte, Schooler & Gabbino 1997, Melcher & Schooler 1996).
The requirement of verbalisation may also have imposed an unnecessarily linear structure on the way that participants used the visual representation. The imposition of narrative structures on visual and spatial material is well documented in experiments involving description of geometric structures (Levelt 1981) and of building layouts (Linde & Labov 1975) although Taylor and Tversky (1996) noted that the study by Linde and Labov may simply have reflected linear structures in their experimental task. Davies and Castell (1992) have also noted that expert programmers tend to rationalise their problem solving processes to comply with recommended design methods when thinking aloud during programming tasks. In recognition of these concerns, think-aloud protocols were not used in any of the other experiments described in this thesis.
Notwithstanding any possible effect of verbalisation on reasoning strategy, the visual metaphor used in this experiment may have improved mnemonic performance as a result of dual coding effects (Paivio 1971, 1983), Two of the four novices working without an explanatory metaphor made many more requests to review the diagram component definitions. This may indicate that lack of a metaphor made the definitions more difficult to remember, but it is not possible to draw definite conclusions when the effect was only observed among half of a small treatment group. The potential effect of explanatory metaphors on memory for diagram definitions is examined in far more detail in chapter 6. No similar effect was observed in experts, but this is unsurprising. Firstly, the computational domain provides a familiar context within which experts could encode the definitions of the components. Secondly, studies of experts in other domains have shown that they are more likely to attend to configuration in abstract material while novices attend to surface detail (Hekkert & van Wieringen 1996, Lowe 1993b).
The interaction between representational detail and abstraction is perhaps the most interesting observation to be drawn from the verbal protocol data in this experiment. It appears that novices may have inhibited abstract descriptions of the problem when using the metaphorical representation. Several observers have noted that the use of concrete representations can limit the formation of abstractions in fields such as mathematics education (Pimm 1995), learning programming (di Sessa 1986) and more general educational contexts (Dale 1969). This may lend support to theories describing the limitations of visual representations for reasoning about abstraction (Wang, Lee & Zeevat 1995, Green & Blackwell 1996b) or negation Dopkins (1996). A more prosaic potential explanation is that the version of the notation with geometric symbols, having a cultural association with technical matters, may have encouraged participants to use "technical" terms that would not otherwise be common in their vocabulary. Similar instances of novices adopting an overtly technical vocabulary have been observed before by van der Veer, van Beek & Cruts (1987) and Scapin (1981). The apparent relationship between geometric notations and abstract reasoning is investigated in far more detail in chapter 5.
Experiment 1 failed to find the anticipated benefits of incorporating a metaphorical virtual machine in the design of a visual programming language. Those benefits were expected on the basis of much previous research describing mental models and virtual machines in programming. Experiment 1 could be refined and extended, further to investigate the cognitive tasks involved in programming, such as those reviewed by Davies (1993). The main concern of this thesis, however, is to explore the claims that visual representations support abstract problem solving through their metaphorical reference to entities and structures in the physical world. The validity of those claims is widely assumed in visual programming language research, as described in the surveys of chapter 3. The results of this investigation can therefore be relevant to visual programming language design, without covering the same ground considered in many other theories of program construction.
This second experiment therefore considers experimental tasks that do not, on the surface, resemble computer programming. Neither were participants told that the experiment had any relationship to computer programming. Instead, it attempts to isolate the use of metaphor to represent abstract concepts in physical terms. In this experiment, moreover, the diagrams do not resemble physical machines. The metaphorical interpretation is provided in explanatory text, in a way that is more typical of visual programming languages, where the diagrams are displayed using simple geometric elements, and users are only aware of the metaphor as a result of explicit instruction.
The four diagrams used in this experiment did not refer specifically to computer programs, although they expressed concepts that are more often found in computer programs than in everyday life. I presented the diagrams to participants using (slightly contrived) non-software task contexts where the concepts could be applied. The four computational concepts were:
I developed four diagrams to express these concepts, based on verbal descriptions of the concept by Finkel (1996), and employing conventional symbolic elements from fields other than software, as collected in Dreyfuss (1972). The explanation of each diagram incorporated either a systematic metaphor that compared the graphical elements to some physical situation with an appropriate structure, or a nonsense metaphor that compared them to an irrelevant physical situation.
The diagram expressing closure is shown in Figure 4.12. The task context described a sports team on tour, where a playing side is allocated for each game. The diagram shows each game as a separate line, with the original tour team at the bottom of the diagram, and successive games drawn above that line. The introduction of new players is shown as a "bump" in the appropriate position corresponding to the player in the original team who has been replaced.
Figure 4.12. Diagram showing closure in terms of sports teams.
Eg: Cole plays in the first game, but is replaced by Biggs for the second and third
For this diagram, the systematic metaphor described the lines as layers of new surfacing laid on top of a road, so that the inclusion of new material is visible as a bump in later layers. The nonsense metaphor described the overall shape as an ice-cream cone with jelly beans stuck in it, and the junction at the left of the diagram as a fork.
The diagram expressing database joins is shown in Figure 4.13. The task context described an airline booking system, in which a flight information table must be matched with a passenger booking table and a checked luggage table. Each table of information is shown as a vertical line of connected data items. Where tables are joined on particular data items, those items are linked together by a line drawn between the appropriate items. The data items that will be returned as the result of the join are indicated by a funnel shape at the side of each selected item.
Figure 4.13. Diagram showing database join in terms of airline bookings.
Eg: find all records of passengers and luggage on a particular flight, and match them by seat number
For this diagram, the systematic metaphor described the vertical lines as tags threaded onto pieces of string, with matching tags joining the pieces of string together. Output of data items was described in terms of the tags dropping into funnels. The nonsense metaphor described the lines as cracks in a flagstone, and the circles as manhole covers which were dangerous when missing.
The diagram expressing flow of control is shown in Figure 4.14. The task context described a washing machine cycle, in which a range of processes must be started, stopped or repeated a certain number of times according to conditions such as water level and temperature. Each process is shown as a circle, which may include other sub-processes. The signal to start a process is shown by a line with a star at the end, while a stop signal is shown by an arc at the end. One process can be made to start when another stops, shown by a jagged line at the first process.
Figure 4.14. Diagram showing flow of control in terms of a washing machine cycle.
Eg: Once filling has completed, start washing, until a fixed time has elapsed
For this diagram, the systematic metaphor described the process circles as turning cogs. The star showing when a process starts resembles a starting cog, while the arc showing when it stops resembles a brake shoe. The jagged line is a spring which rebounds when the cog that it is attached to stops. The nonsense metaphor described the circles as rock pools, with the stars and jagged lines resembling starfish and worms. As in experiment 1, the dynamic nature of the systematic metaphor in this case was intended to support depictive mental animation as proposed by Schwartz and Black (1996a, 1996b), whose experimental investigation of reasoning from mechanical diagrams did in fact describe a diagram based on turning cogs.
The diagram expressing visibility is shown in Figure 4.15. The task context described a telephone switchboard in a large organisation. There are some people in the organisation who would never deal directly with queries from the public, while others would often do so. This diagram is a modification of an organisation chart, showing which people are prepared to deal with the public (a circle by their name, rather than a square or half-circle), and how calls might be referred by the receptionist from one person to another (dashed lines).
Figure 4.15. Diagram showing visibility in terms of a telephone switchboard.
Eg: one of the accounts assistants will always take queries from the public, while the other never will
For this diagram, the systematic metaphor described the chart as a railway network, and each person's office as a station. The circle represented a public revolving door, the square a closed door, and the half circle a door that was ajar. The different dashed lines represented the relative priority of railway lines and roads. The nonsense metaphor described the diagram as representing an airport, with circles being bicycles, the squares garages, and the half circles as aircraft hangars. The dashed lines were described as rows of people sitting behind each other on an aircraft.
After reading the explanations of the diagrams, participants completed three different tasks using each diagram. In the first task, participants answered comprehension questions relating to an example of the diagram. These questions were phrased to involve an element of problem solving using the notation, rather than simply providing definitions of diagram elements, or reading information directly from the diagram.
In the second task, participants completed an incomplete diagram. The diagram was accompanied by text stating, in terms of the problem domain, what information was missing. Participants then completed the diagram by drawing the missing graphical elements in appropriate places. An example constraint for the closure diagram is: "Bloggs played in the whole of the first game, and also in the second half of the third game. Biggs was substituted for the whole series after Cole was injured." (This is the constraint shown in figure 4.12).
The third task also involved completion of an incomplete diagram. In this task, participants completed the diagram by writing missing labels onto a diagram that was otherwise complete. As before, the position of the labels was deduced from text describing a problem situation, and listing the labels that were to be added. An example for the visibility diagram is: "The service manager can be contacted sometimes, but does not pass on queries, the store manager would always pass on queries to the storeman. The production director can only receive queries from the chairman."
All task instructions, together with the diagram they apply to, are reproduced in Appendix B.2.
The experimental material was presented as a bound booklet containing both explanations of the diagrams and comprehension tests. Participants were instructed to work through the booklet in order, without turning back to look at previous pages. At the top of each page was a box where the participant wrote the time when they started work on that page. Participants read the time from a large stopwatch placed on the table in front of them.
Sixteen participants were recruited from two different populations. The first independent variable was level of expertise in these populations: eight participants were volunteers registered with the APU Subject Panel, none of whom had any experience of computer programming ("novices"). The other eight were experienced programmers employed at the Advanced Software Centre of Hitachi Europe Limited. A further two programmers were recruited from the same population after two of the expert cohort did not complete the experiment. This was as a result of work-related interruptions. The two who were replaced are not considered any further.
The second independent variable was the type of metaphor provided in the explanation of the diagram. This was varied as a repeated measure: each participant received two explanations with the systematic metaphor, and two with the nonsense. Diagrams could not be presented to a given participant with both forms of the explanation, however. This design was therefore a balanced confound between diagram and metaphor type.
The order of the four diagrams was balanced within each group of eight participants. The order of the instruction types was not varied; a pilot experiment had shown that if participants received the nonsense metaphor first they would ignore the rest of the metaphors as being irrelevant. Presentation order was therefore: systematic, nonsense, systematic, nonsense.
The third independent variable was the type of task performed: answering comprehension questions, drawing missing graphical elements on an incomplete diagram, and writing missing text on an incomplete diagram. The three types of task were always presented in this order.
There were two dependent variables. The first was the speed with which participants completed each comprehension task. The second was accuracy on the comprehension tasks. The possible total score for each diagram type and comprehension task varied according to diagram complexity, but the balanced confound design meant that it was necessary to compare scores between different diagrams. I therefore calculated a normalised score for each task, in which the lowest score was assigned a normalised value of zero, and the highest a value of 100. All other scores were normalised by a linear interpolation between these values.
The three hypotheses are described in terms of relative performance, which was evaluated in terms of both speed and accuracy in order to identify possible speed-accuracy trade-offs made by participants.
Participants read a page of general instructions at the front of the booklet, then worked through at their own pace, writing the time at the top of each page as instructed. (The instructions are reproduced in appendix B.2). The experimental procedure was determined by the order of the pages in the booklet. The order was as follows:
| Page | Contents |
| 1 | General instructions: completing the booklet, and writing times. |
| 2 | Explanation of an example of the first diagram. |
| 3 | Questions testing comprehension of the first example. |
| 4 | Explanation of an example of the second diagram. |
| 5 | Questions testing comprehension of the second example. |
| 6 | Explanation of an example of the third diagram. |
| 7 | Questions testing comprehension of the third example. |
| 8 | Explanation of an example of the fourth diagram. |
| 9 | Questions testing comprehension of the fourth example. |
| 10-13 | Drawing missing elements on examples of each diagram. |
| 14-17 | Writing missing text on examples of each diagram. |
Table 4.3. Booklet presentation order
The comprehension questions were scored by awarding one point for each item of information that corresponded to the worked solution, and subtracting one point for each incorrect piece of information. Drawing tasks were scored by awarding a mark for each element added in an appropriate place and a further mark if the element was the correct shape. A mark was subtracted for each unnecessary element, and a further mark if the additional element violated either the task constraints or the original diagram definition. The writing task was scored by awarding a mark for each label written in the correct place, and subtracting a mark for each label written in a place that violated the constraints.
The first hypothesis was that experts would perform better than novices. The times taken by each group to complete the three tasks, as well as the mean accuracy achieved by each group, are shown in Figure 4.16. Analysis of variance (ANOVA) indicates that experts were significantly more accurate, F(1,14)=5.48, p<.05. Experts did not finish the tasks more quickly - in fact they spent slightly longer, but this difference was not significant.
Figure 4.16. Relative performance of experts and novices
The second hypothesis was that a systematic metaphor would bring novice performance closer to that of the experts. Figure 4.17 shows the interaction between expertise and metaphor type. As expected, accuracy is poorer when the nonsense metaphor has been given. This difference does appear to be greater for novices than for experts, but the interaction is not significant. The effect of this interaction on the time taken to complete the tasks indicates that novices spend more time trying to use the nonsense metaphor, while experts spend less time. This interaction is not significant either, however.
Figure 4.17. Interaction of systematic metaphor with expertise
There was a significant interaction of task type with experience, F(2,28)=5.60, p<.01. Experts performed best in the task where a diagram was completed by drawing in missing elements. Novices performed more poorly on this task than on other tasks, with an average drawing score of 34%, versus 65% for experts. If the effect of metaphor is considered separately for each task type within the novice sample, metaphor appears to have had no effect at all on drawing task performance. As shown in figure 4.18. mean performance on comprehension and text completion tasks is higher in the metaphor condition, but this interaction between task and metaphor is not statistically significant, F(2,6)=0.95, p=.436.
Figure 4.18. Effects of metaphor by task type for novices
As in experiment 1, the performance measures used in this experiment provide a meaningful distinction between novice and expert performance which sets a reference point for the amount of benefit that metaphorical instruction provides to novices. Unlike experiment 1, experts did not perform these tasks significantly faster than novices. They did achieve far greater accuracy, however. In experiment 1 metaphor had little further effect on the performance of experts, and that finding was repeated here. The accuracy of the experts was near ceiling, however, so metaphor might have had more effect with a more difficult task. That possibility is not of great concern here, as this thesis concentrates on the benefit that metaphor can provide for novices.
The difference between novices and experts in this experiment may, however, have resulted as much from the fact that experts were better able to identify and ignore the nonsense metaphors - novices tended to spend more time on tasks for which they had been given nonsensical explanations. This effect is investigated in more detail in experiment 7, which compares systematic and nonsense metaphors to a further condition in which no metaphor is given at all.
The final point of interest in these results is the differences observed in performance for the diagram drawing task. Experts performed better than novices on this task - this may be a result of the fact that experienced programmers are more accustomed to drawing diagrams, so their advantage arose from being comfortable and practised with similar tasks. In contrast, several of the experiments reported in the next chapter asked non-programmers to draw complete diagrams. The participants in those experiments often reported anxiety regarding their ability to draw.
In this experiment, novice performance in the drawing task was least affected of all the tasks by the provision of an explanatory metaphor. This may arise from the anxiety factor described above - the drawing task may have been subject to a floor effect, and a consequent reduction in the effect of metaphor, in the same way postulated earlier as arising from a ceiling effect in experts. Alternatively, participants may have relied on an uninterpreted visual image of the whole diagram, treating the drawing task as a short term visual memory problem rather than a comprehension problem. For novices using this strategy, a systematic metaphor would be less likely to have any effect on performance. The distinction between memory and comprehension, as well as between visual and relational components of diagrams, is investigated in far more detail in the experiments reported in chapter 6.
Continue reading chapter 5 , or return to table of contents and download information .