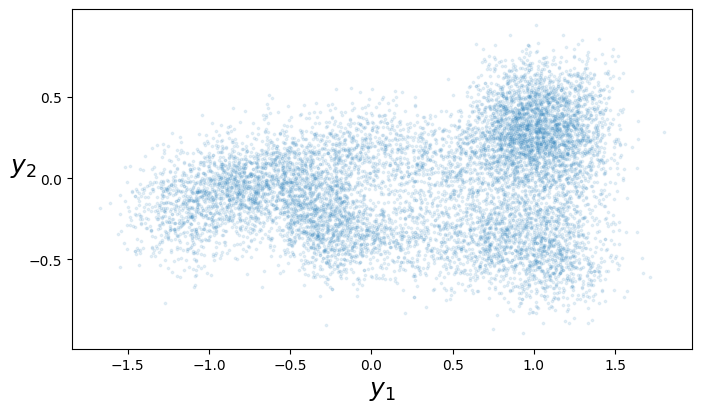
You will work with a dataset consisting of \((x_i,y_i)\) pairs, \(i\in\{1,\dots,10\,000\}\), where \(x_i\in\mathbb{R}\) and \(y_i=(y_{1,i},y_{2,i})\in\mathbb{R}^2\). Here is a scatterplot showing just the \(y\) values.
For this challenge, you are asked to model the dataset as \[ \begin{bmatrix} Y_{1,i}\\Y_{2,i} \end{bmatrix} \sim \mu(x_i) + \begin{bmatrix} N(0,\sigma^2)\\N(0,\sigma^2) \end{bmatrix} \] Here \(\mu:[0,1]\to\mathbb{R}^2\) is some function to be learned, and the standard deviation \(\sigma\) is also to be learned. The idea is that \(\mu(x)\) can be thought of as a line drawing, as you’ll see when you run the code below to show your fitted \(\mu\) function.
url = 'https://www.cl.cam.ac.uk/teaching/current/DataSci/data/pointcloud.csv'
pointcloud = pandas.read_csv(url)

fig,ax = plt.subplots(figsize=(4,3))
ax.set_aspect('equal')
ax.scatter(pointcloud.y1, pointcloud.y2, s=1, alpha=.1)
xnew = np.linspace(0,1,1000)
ynew = ... # compute μ(xnew), get a 1000×2 matrix
ax.plot(ynew[:,0], ynew[:,1])
plt.show()Submit two files, rwiggle2d.py containing
your model code and rwiggle2d.pt.zip containing your fitted
weights, on Moodle.
Your model code should be a PyTorch module, matching this template.
class RWiggle2d(nn.Module):
    def __init__(self):
        self.σ = ... # a scalar value, the σ in the model
    def forward(self, x):
        # Input: x is a tensor of shape (n,) and dtype torch.float
        # TODO: evaluate μ(x) and return a tensor of shape (n,2)
After you’ve trained your model, save your model parameters using
torch.save(mymodel.state_dict(), 'rwiggle2d.pt.zip')
# or, to load: mymodel.load_state_dict(torch.load('rwiggle2d.pt.zip'))
(You don’t need to zip this file yourself. PyTorch’s default save format is a zip file.) The Moodle tester will run your model on a holdout set of size \(n\), and compute the log likelihood. Since Moodle demands that scores should be within a fixed range, it will actually report \[ \frac{e^{\text{loglik}/n}}{1+e^{\text{loglik}/n}} \times 100 \] You should be able to get a score of 70/100 quite easily on a low-powered laptop.