ex1: practical exercises for Example Sheet 1.

The example sheet asks you to implement the three classes given below: PoissonModel, PiecewiseLinearModel, and StepPeriodModel. The class skeletons are given, and you should fill in the missing pieces. To test your answers on Moodle, please upload either a Jupyter notebook called ex1.ipynb or a plain Python file called ex1.py.

In [ ]:
import numpy as np
import scipy.optimize
import sklearn.linear_model

Poisson model. Suppose we're given a dataset $[x_1,\dots,x_n]$. We wish to fit the model that says each $x_i$ is an independent sample from the Poisson(λ) distribution. Estimate λ using scipy.optimize.fmin.

Note. If the tester reports that your answer is a little bit off, try increasing the precision that scipy.optimize.fmin is using by e.g. passing in the argument xtol=0.00001.

class PoissonModel():
    def __init__(self):
        self.λ_ = np.nan
    def fit(self, x):
        # Input: x is a numpy vector of integers
        # TODO: set self.λ_

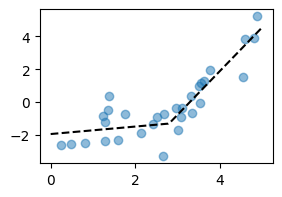
Piecewise linear response. Suppose we're given a dataset of $(x_i,y_i)$ pairs. We wish to fit a model for $y$ as a function of $x$, made up of two straight lines. The function must be continuous, i.e. the two straight lines must meet at an inflection point. The $x$-coordinate of the inflection point is given.


class PiecewiseLinearModel():
    def fit(self, x, y, inflection_x):
        # Input: x and y are numpy vectors of real numbers, inflection_x is a real number
        # TODO: fit the model, and store its parameters
    def predict(self, x):
        # Input: x is a numpy vector of real numbers
        # TODO: return a numpy vector of real numbers, with the predicted y values

Stepwise climate model. We're given a time series consisting of $(t_i,\text{temp}_i)$ pairs, recording average daily temperatures in °C. Here time is measured in years, and readings are monthly. We wish to fit a model which describes the temperature as a sinusoid plus a step response function, $$ \text{temp} \approx \beta_1 \sin(2\pi t)+\beta_2 \cos(2\pi t) + ??? $$ where the last term tells us the decadal average temperature. (Take decades to be represented by their start year, np.floor(t/10)*10.)


class StepPeriodicModel():
    def fit(self, t, temp):
        # Input: x and y are numpy vectors of real numbers
        # TODO: fit the model, and store its parameters
    def predict_step(self, t):
        # Input: t is a numpy vector of real numbers
        # TODO: return a numpy vector of real numbers, with the predicted decadal average temperatures
        # (i.e. the ??? part of the equation above, not including the sinusoidal part).
        # It should return np.nan for timepoints outside the range where we have data.

TEST

The Moodle checker will look for a markdown cell with the contents # TEST, and ignore everything beneath it. Put your working code above this cell, and put any experiments and tests below.

In [ ]:
import pandas
import matplotlib.pyplot as plt
In [ ]:
# Test the Poisson model (where we know the true answer from algebra)

x = [3,2,8,1,5,0,8]
m = PoissonModel()
m.fit(x)
assert np.isclose(m.λ_, np.mean(x), rtol=1e-3)
In [ ]:
# Plot the piecewise linear model

df = pandas.read_csv('https://www.cl.cam.ac.uk/teaching/current/DataSci/ticks/res/piecewiselinear.csv')

m = PiecewiseLinearModel()
m.fit(df.x, df.y, 2.8)

fig,ax = plt.subplots(figsize=(3,2))
ax.scatter(df.x, df.y, alpha=.5)
xnew = np.linspace(0,5,100)
ax.plot(xnew, m.predict(xnew), color='black', linestyle='--')
plt.show()
In [ ]:
# Plot the stepwise climate model

climate = pandas.read_csv('https://www.cl.cam.ac.uk/teaching/current/DataSci/ticks/res/climate_202309.csv')
df = climate.loc[(climate.station=='Oxford') & (~pandas.isna(climate.temp))]

m = StepPeriodicModel()
m.fit(df.t, df.temp)

# For Oxford, t=1855, the expected answer is 9.55417.
# If your code produces an answer around 3.039, you've probably included the sinusoid in your prediction,
# which is not what's wanted. You are meant to fit a model that includes the sinusoid,
# but your predict_step function should only return the non-sinusoid part of the fitted model.
# If your answer is off by a little bit, perhaps you've specified an unidentifiable model
# (i.e. linearly dependent features), causing sklearn.linear_model to lose precision.
test_years = [1855,1965]
pred = m.predict_step(np.array(test_years))
print(pred)
assert np.allclose(pred, [9.55417, 9.855]), f"Answers for {test_years} not what was expected"

fig,ax = plt.subplots(figsize=(5,2.5))
tnew = np.arange(1850,2030,10)
ax.step(tnew, m.predict_step(tnew), where='post')
plt.show()