Tick 2. Economic mobility

Some degree of inequality might be acceptable if economic mobility were high, i.e. if everyone had similar chances of reaching either end of the wealth distribution. Economic mobility is often measured by splitting the population into five equal brackets ("quintiles"), and measuring the chance of moving between brackets. From a report by the Brookings Institute,

Contrary to American beliefs about equality of opportunity, a child’s economic position is heavily influenced by that of his or her parents. 42% of children born to parents in the bottom fifth of the income distribution remain in the bottom, while 39% born to parents in the top fifth remain at the top.

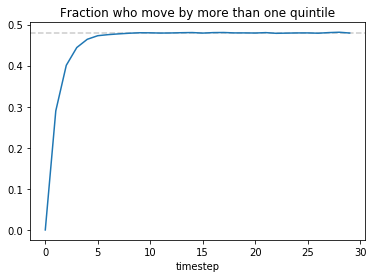
Let's measure economic mobility by recording the wealth distribution at one timepoint, and again some number of timesteps later, splitting the two distributions into quintiles, and counting what fraction of the population moved by more than one quintile from beginning to end. (In each timestep a median individual might find their wealth increasing or decreasing by around 50%, so one timestep corresponds roughly to several years of human life.) For example, if we have a population of 5000 and we draw up a matrix $A$ where $A_{i j}$ is the number of people who start in quintile $i$ and end up in quintile $j$, we might get $$ A = \left( \begin{matrix} 344& 313& 243& 100& 0\\ 266& 261& 302& 167& 4\\ 212& 260& 225& 272& 31\\ 147& 143& 183& 331& 196\\ 31& 23& 47& 130& 769 \end{matrix} \right) $$ (A quick check: the row sums and column sums are all 1000.) The number who moved by more than one quintile is 1148, which is 23% of the population.

Questions

Use these autograder settings:

import ucamcl
GRADER = ucamcl.autograder('https://markmy.solutions', course='scicomp_2022').subsection('tick2')
This assignment tests your vectorized thinking. You will be asked to run simulations on a population of hundreds of thousands of individuals, over many timesteps. YOUR CODE MUST USE NUMPY VECTORIZED OPERATIONS rather than iterating over the population. You may use Python iteration over timesteps.

Question 6. In a perfectly mobile economy, where everyone has equal chance of reaching any quintile, what fraction of people are expected to move by more than one quintile?

q = GRADER.fetch_question('q6')
GRADER.submit_answer(q, your_answer)

Question 7. Write a function mobility(v,w) that returns the proportion of people who moved by more than one quintile, where v[i] and w[i] measure respectively the wealth of individual $i$ at the beginning and end of a time period. Hint: look up np.percentile and np.digitize.

# Submitting your answer:
q = GRADER.fetch_question('q7')
v,w = np.arange(q.n)**q.a, np.arange(q.n)**q.a * np.random.random(q.n)
GRADER.submit_answer(q, mobility(v,w))

Question 8. Simulate the kinetic exchange model from Tick 1 long enough for it to stabilize; call this time $T$, and let the wealth vector be $w_T$. Run the model $t$ timesteps further to time $T+t$, find the wealth vector $w_{T+t}$, and compute $\textsf{mobility}(w_T, w_{T+t})$. It's up to you to decide how to judge stabilization; you don't have to explain your method but you do have to submit a correct answer.

# Submitting your answer:
q = GRADER.fetch_question('q8')
# For a population size q.n, measure mobility over from time T to time T+q.t
GRADER.submit_answer(q, your_answer)

Question 9. Plot the social mobility for a population of 500,000 as in Question 8, over a sequence of timesteps. To be precise, plot $\textsf{mobility}(w_T, w_{T+t})$ on the $y$-axis and $t$ on the $x$-axis. You don't have to submit your plot, but it may be assessed in the ticking session. Your plot should look something like this:

mobility