Figure 9
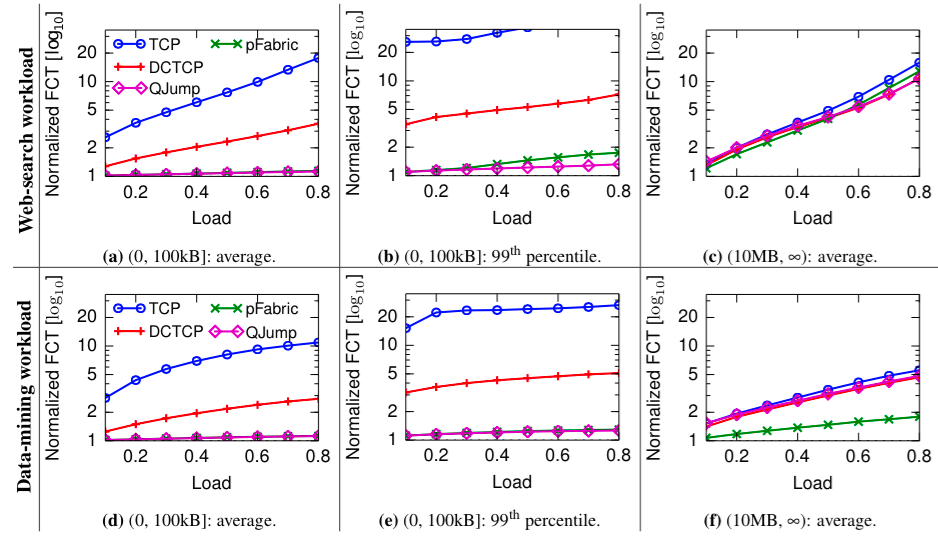
Figure 9 (page 10) compares QJump to DCTCP and pFabric using the simulation environment NS2. Although QJump is not directly intended as a network scheduler, it performs well.
Figure 9
Software Required
In addition to these general software requirements, we also used:
- NS2 Network Simulator 2.34
Patches
NS2 2.34 on Ubuntu
NS2 2.34 does not natively build on Ubuntu based systems. Execellent instructions for resolving this can be found here and here . We have packaged up the code changes into ns-allinone-2.34.ubuntu.patch to make it easy. To build and install NS2:
sudo apt-get update
sudo apt-get install build-essential autoconf automake libxmu-dev xorg-dev g++ xgraph
tar -xvf ns-allinone-2.34.tar.gz
cd ns-allinone-2.43
patch -p1 < ../ns-allinone-2.34.ubuntu.patch
./install
Then follow the instructions about setting up your path variables.
DCTCP / pFabric on NS2 for Ubuntu
We wish to offer our most sincere thanks to the authors of pFabric and DCTCP, especially Mohammad Alizadeh, Shuang Yang and Nick McKeown who have been instrumental in helping us to build on thier results. The patch file can be found here (pfabric.patch). To apply the patch:
cd ns-allinone-2.43/ns2-2.34/
patch -p1 < ../../pfabric.patch
make clean
make
QJump on NS2 with DCTCP/pFabric
Once the pFabric patches have been installed, ns-allinone-2.34.qjump.patch can be applied too. To do so:
cd ns-allinone-2.43/
patch -p1 < ../ns-allinone-2.34.qjump.patch
cd ns2.2.34/
make clean
make
Running Experiments
With NS2 patched for pFabric, the baseline, DCTCP and pFabric results can be generated simply by running the driver script found here. The drive_all.sh script assumes that you have at least 8 cores and 16GB of RAM. It will run 8x experiements in parallel and iterate over the baseline, pFabric and DCTCP. For each it will create a directory with the results in them.
./drive_all.sh
With NS2 patched for QJump, the results can be generated simply running the driver script found here. The drive_qjump.sh script assumes that you have at least 8 cores and 16GB of RAM. It will run 8x experiements in parallel. For each it will create a directory with the results in them.
./drive_qjump.sh
Raw Data
The raw data can be found here. The archive contains 64 directories. Each directory contains a file called "flow.tr". The directories are:
- baseline_[learning|serach]_0.[1-8] - TCP Droptail on learning or search workloads, load factors 0.1 to 0.8
- dctcp_[learning|serach]_0.[1-8] - DCTCP on learning or search workloads, load factors 0.1 to 0.8
- pfabric_[learning|serach]_0.[1-8] - pFabric on learning or search workloads, load factors 0.1 to 0.8
- qj_[learning|serach]_0.[1-8] - QJump on learning or search workloads, load factors 0.1 to 0.8
Each flow.tr file has the following format:
number of packets, flow completion time, number of timeouts, src ID, dst ID
Processing and plotting the results
The processing and plotting scripts can be found here. We process the data into a more compact form using the following, which calcualtes the mean and 99th percentile normalised flow completion times for 3 regions: (0,100Kb](100kB,10Mb](10Mb,infinity).
files="";
for f in $(ls -d *_0.*); do
lab=$(echo $f | tr "_" ".");
files="$files $f/flow.tr $lab";
done;
python ./figure9/generate_ns2_statistics.py $files ../data/ns2_results_all/all_stats.txt
Finally, we plot the results for the web-search workload using the following:
for p in mean 99th; do
for r in 1 2 3; do
python plot_ns2_flow_completion.py all_ns2_results.txt ${p} search ${r} baseline dctcp pfabric qj ../plots/ns2_learning_${p}_region${r};
done;
done
And the learning workload as follows:
for p in mean 99th; do
for r in 1 2 3; do
python plot_ns2_flow_completion.py all_ns2_results.txt ${p} learning ${r} baseline dctcp pfabric qj ../plots/ns2_learning_${p}_region${r};
done;
done