Figure 11
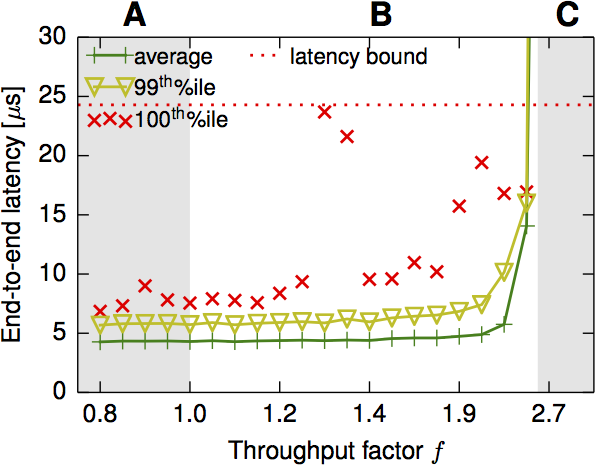
Figure 11 (Page 11) shows how performance varies as a function of the f "throughput factor". In the experiment, we emulate 66 hosts on a three level network topology generating both line-rate low prioirty and low-rate, high prioirty traffic. The emulated hosts generate real traffic on the network, which is mesured with the assistance of a high precision Endace DAG capture card. The figure both validates that the QJump equation bound holds, and gives a sense for how sensitive it is to getting f values wrong.
WARNING This experiment requires use of an Endace DAG 9.2x2 or similar capture card and two passive optical taps for high fidelty network capture.
Figure 11
Software Required
In addition to these general software requirements, we also used:
- QJump kernel module
- QJump application utility
- camio-perf as found in qjump-camio-tools
- dag-capture as found in qjump-camio-tools
- dag-analyse as found in qjump-camio-tools
- dag-join as found in qjump-camio-tools
Physical Configuration
The basic physical network configuration is described here. In addition to the standard setup, every host was configured with a second link into the network. The second network was idential to the first, except that IP's were configured as a 10.10.1.x subnet. In effect, this expanded the network from a 12 node network to a 24 node network. Finally, two passive optical splitters were inserted into the network. The first was inserted on the outgoing link between Quorum207 (H12) and the network. The second was inserted on the incoming link between the network and Quorum205 (H10). This allowed us to capture the in network time between Quorum207 and Quourm205. The following software was run:
- All machines except Quorum205 (H10) ran 6 traffic generators (camio-perf), 3 on each network port, rate-limited, but with high prioirty (7)
- All machines except Quorum205 (H10) ran 2 traffic generators (camio-perf), 1 on each network port, at line rate, but with low prioirty (0)
- Quorum 205 (H10) ran two traffic skinks (netcat) to supress ICMP not delivred messages.
- Quorum 208 (H9) ran the dag-capture tool on an isolated, pinned core.
Sofware Configuration
This is a complex experiment to run and coordinate. It requires:
- Two tarffic sinks to supress ICMP undelivered notification messages
- One Endace DAG capture tool for network measurements
- 66 traffic generators on 11 hosts, 3 per network port, generating packets rate limited to a configurable rate and high prioirty (7)
- 22 traffic generators on 11 hosts, 1 per network port, generating packets at line-rate and low prioirty (0).
- run_factor_expr - Drives the other scripts. Iterates over the rate limiting parameter.
- run_factor_expr.py - Configures and runs the dag_capture tool and the first 33 of the 66 camio_perf instances on the 10.10.0.x subnet.
- run_factor_expr2.py - Configures and runs the second 33 of the 66 camio_perf instances on the 10.10.1.x subnet.
./run_factor_expr
Raw Data
Our original unprocessed datasets can be found here (~75MB ea)(>750MB uncompressed). There are 22 archives. Each archive has a name of the form factor_[XX]. Where XX is the number of microseconds between packets being issued into the network. For the test network as configured, a 25us gap is ideal. Each archive contains the following files:
- dag_capA - the DAG capture from Quorum207 to the network in ERF format.
- dag_capB - the DAG capture from the network to Quorum205 in ERF format.
- README - A complete log of all applications that ran on the 10.10.0.x subnet
- README2 - A complete log of all applications that ran on the 10.10.1.x subnet
Processing and plotting the results
The processing and plotting scripts can be found here. The processing script makes use of the CamIO DAG tools and should be modified to point to the correct directory for them.
./process_all ../data/factor_data/factor_*
The processing script outputs a file called "out" in each subriectory. The out file contains a simple list of latencies for each packet that crossed the network. To plot these, we run the following:
files= $(for i in {29..7}; do echo -n "../data/factor/factor_${i}/out ${i} ; done; )
python plot_throughput_factor_experiment.py "$files" figure11.pdf