| Dataset | Stimulus | Protocol | Datapoints | Unique observers | Individual measurements | Spatial frequency [cpd] | Temporal frequency [Hz] | Luminance [cd/m^2] | Eccentricity [deg] | GE Radius [deg] | Color directions |
|---|---|---|---|---|---|---|---|---|---|---|---|
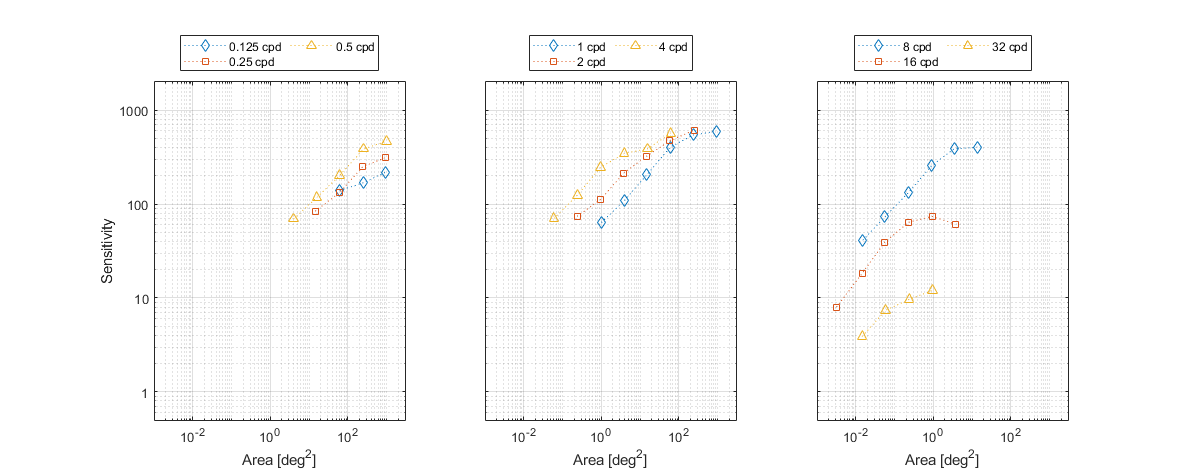
| rovamo1993: Rovamo et al. 1993 [paper] [data] [plot] | grating-rectangular_aperture | 2IFC-detection | 46 | 0 | 0.125, 0.25, 0.5, 1, 2, 4, 8, 16, 32 | 0 | 50 | 0 | 0.031878, 0.0681385, 0.0682448, 0.0697135, 0.132839, 0.133999, 0.136984, 0.138042, 0.268603, 0.272401, 0.275391, 0.276466, 0.533459, 0.54312, 0.553641, 0.553698, 0.56419, 1.0447, 1.0775, 1.09222, 1.10893, 1.10995, 1.12782, 2.08446, 2.14297, 2.15473, 2.18364, 2.22092, 2.2545, 4.33183, 4.37745, 4.41436, 4.42317, 4.44799, 8.7753, 8.87455, 9.00901, 17.2639, 17.5077, 17.675 | 1 | |
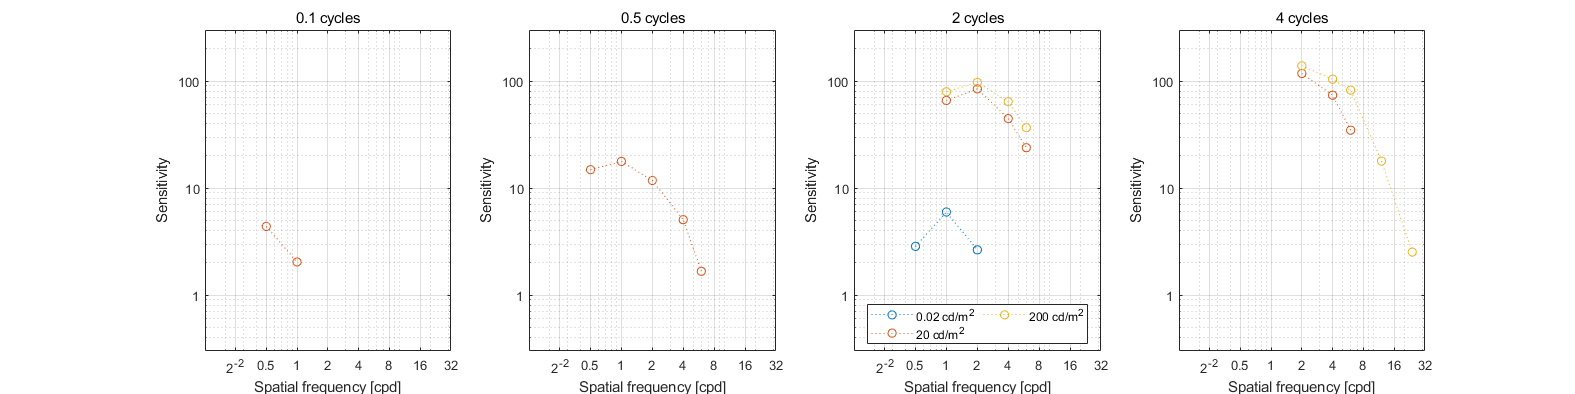
| hdr_csf: High Dynamic Range CSF [paper] [data] [plot] [view stimuli] | gabor | 4AFC-detection | 204 | 31 | ✓ | 0.125, 0.25, 0.5, 1, 2, 4, 6, 12, 24 | 0 | 0.02, 0.2, 2, 20, 200, 2000, 7000, 10000 | 0 | 0.0416667, 0.05, 0.0625, 0.0833333, 0.1, 0.125, 0.166667, 0.25, 0.333333, 0.5, 1, 2, 4 | 3 |
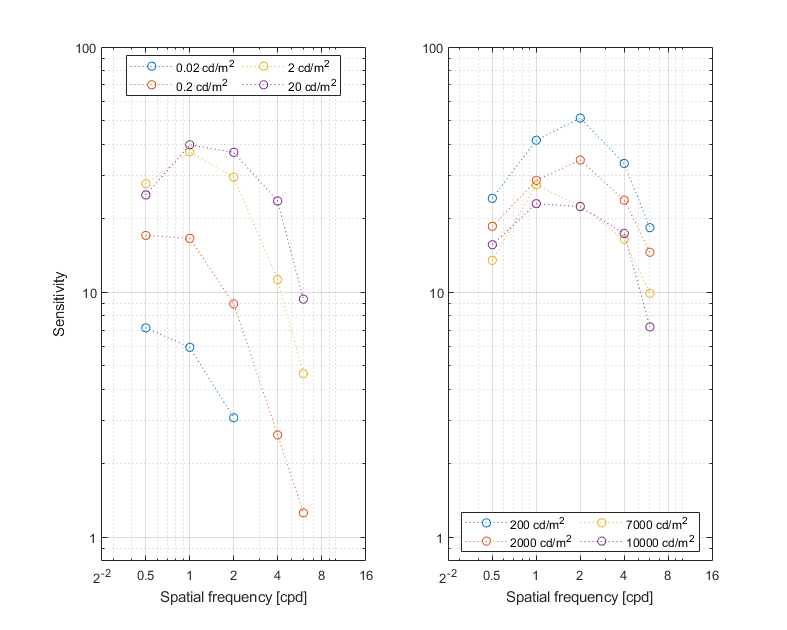
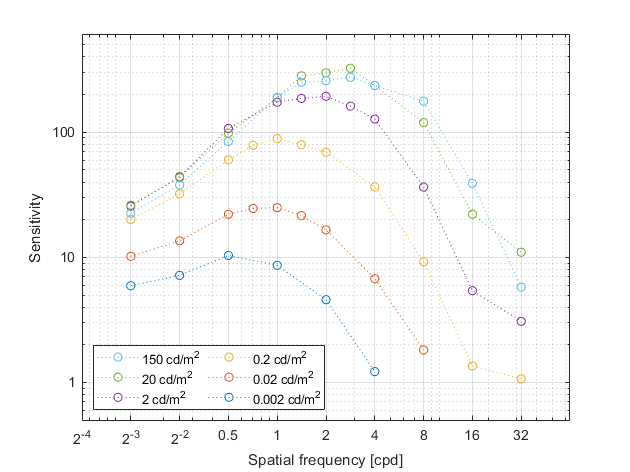
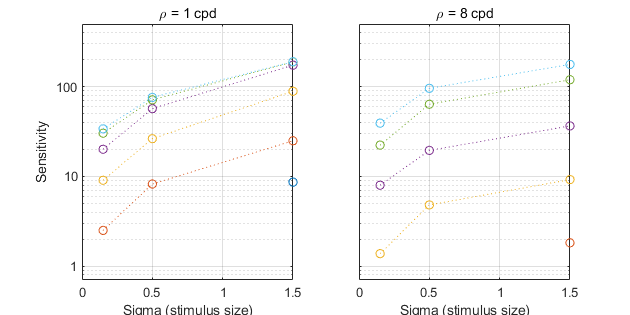
| hdrvdp_csf: HDR-VDP CSF [paper] [data] [plot] [view stimuli] | gabor | 4AFC-detection | 86 | 10 | ✓ | 0.125, 0.25, 0.5, 0.71, 1, 1.41, 2, 2.83, 4, 8, 16, 32 | 0 | 2e-05, 0.0002, 0.002, 0.02, 0.2, 2, 20, 150 | 0 | 0.15, 0.5, 1.5 | 1 |
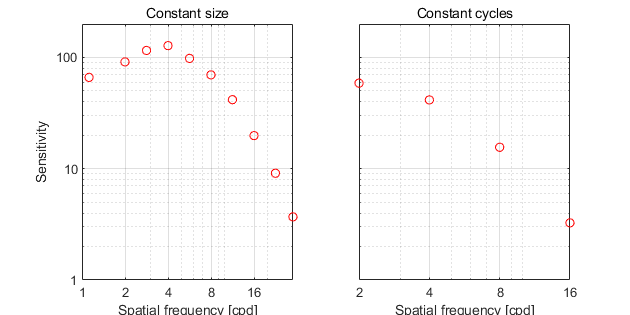
| modelfest: ModelFest [paper] [data] [plot] [view stimuli] | gabor | 2AFC-detection | 14 | 16 | ✓ | 1.12, 2, 2.83, 4, 5.66, 8, 11.3, 16, 22.6, 30 | 0 | 30 | 0 | 0.03125, 0.0625, 0.125, 0.25, 0.5 | 1 |
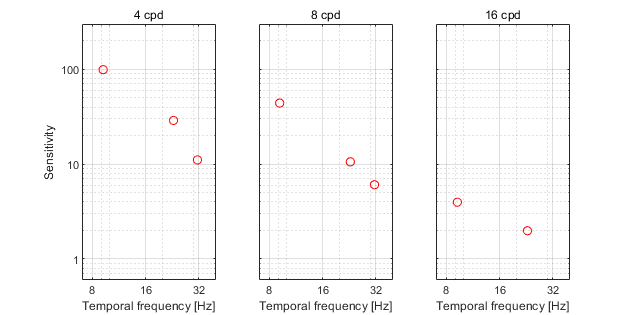
| laird2006: Laird et al. 2006 [paper] [data] [plot] | gabor | 2IFC-detection | 8 | 0 | 4, 8, 16 | 9.1599, 9.2184, 9.2437, 22.954, 22.992, 23.022, 31.432, 31.436 | 60 | 0 | 1.23 | 1 | |
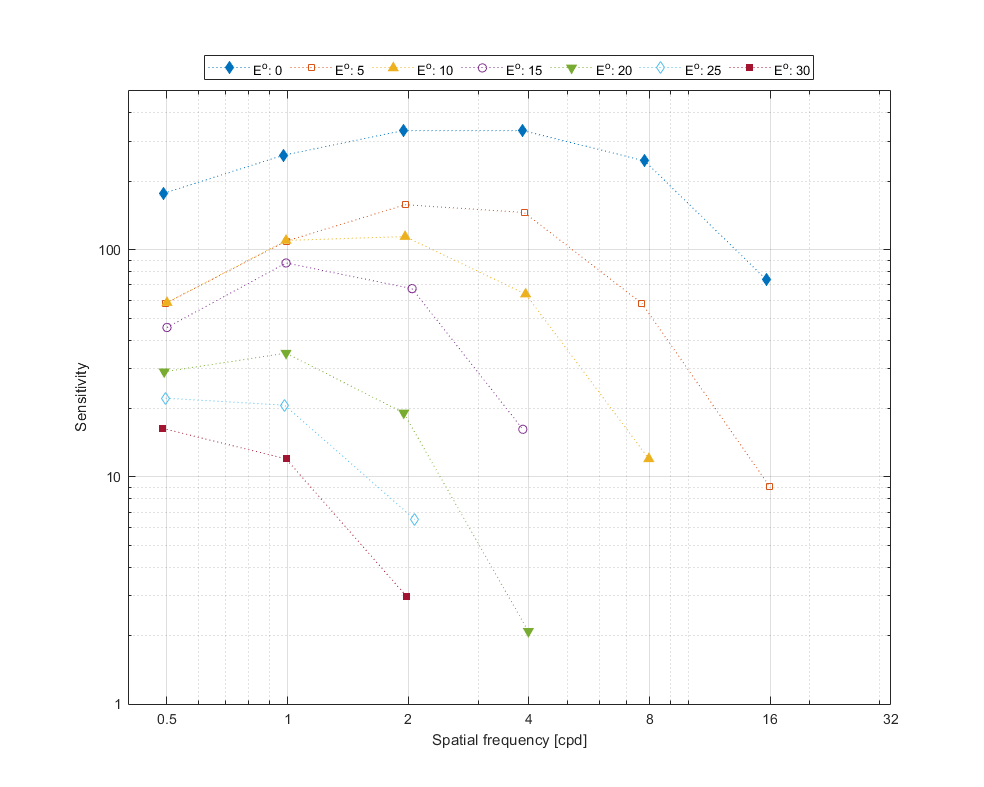
| virsu1979: Virsu & Rovamo 1979 [paper] [data] [plot] | grating-circular_aperture | 2AFC-detection | 31 | 1 | ✓ | 0.488519, 0.491637, 0.49242, 0.496351, 0.500314, 0.977357, 0.983595, 0.991448, 1.94295, 1.94914, 1.9647, 1.98039, 2.0444, 2.07718, 3.86251, 3.89335, 3.92444, 3.98736, 7.65414, 7.76697, 7.96463, 15.6183, 15.9091 | 0 | 10 | 0, 5, 10, 15, 20, 25, 30 | 2.5 | 1 |
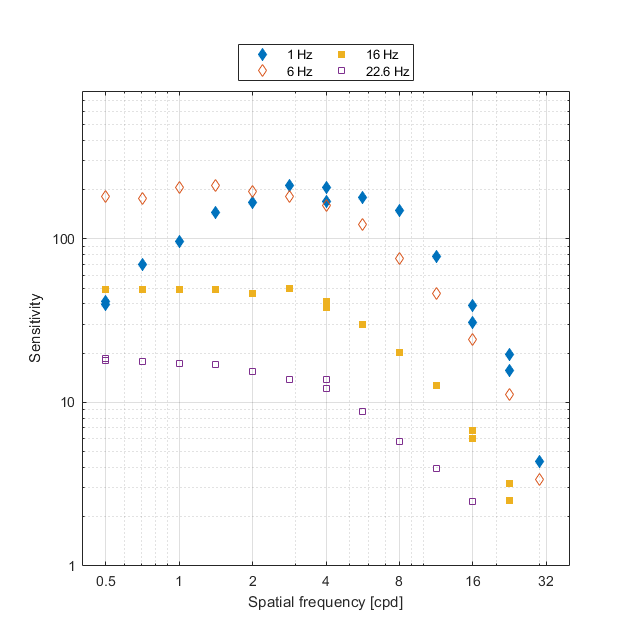
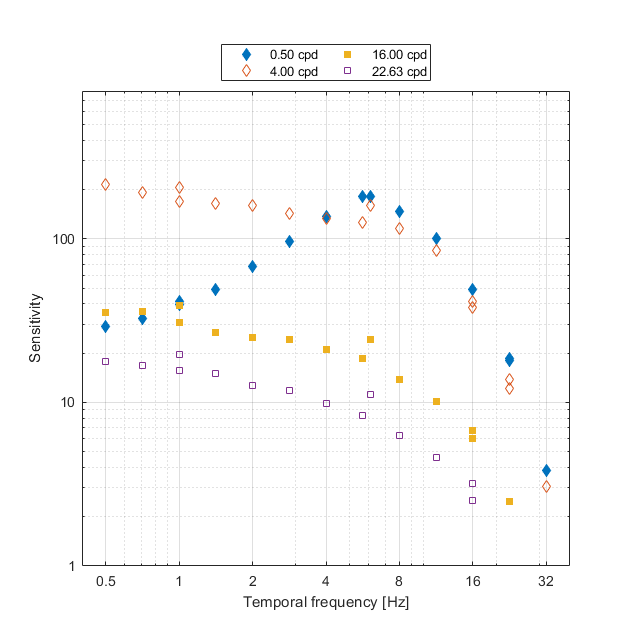
| robson1966: Robson 1966 [paper] [data] [plot] [view stimuli] | grating-ractangular_aperture | 97 | 1 | ✓ | 0.5, 0.707107, 1, 1.41421, 2, 2.82843, 4, 5.65685, 8, 11.3137, 16, 22.6274, 29.8571 | 0.5, 0.707107, 1, 1.41421, 2, 2.82843, 4, 5.65685, 6.06287, 8, 11.3137, 16, 22.6274, 32 | 20 | 0 | 1.25 | 1 | |
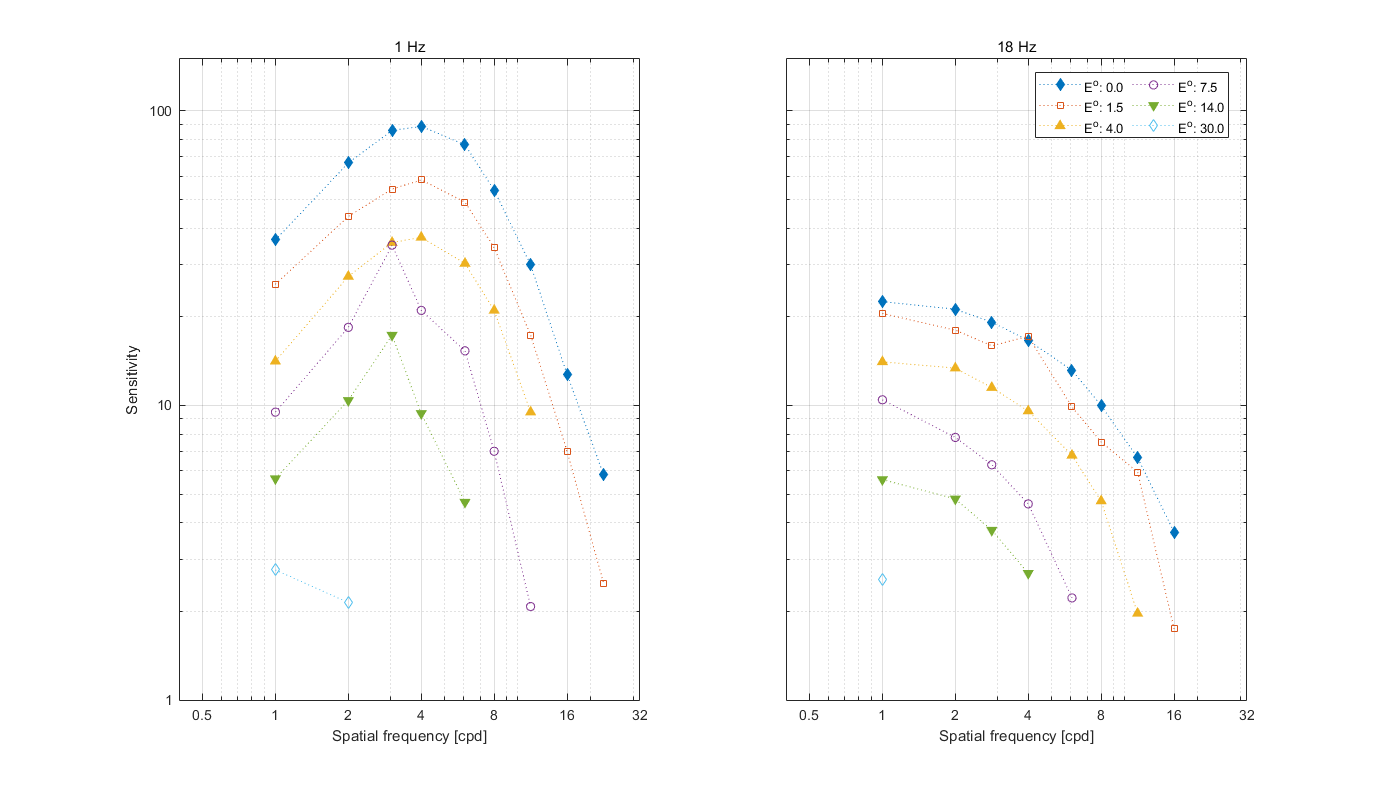
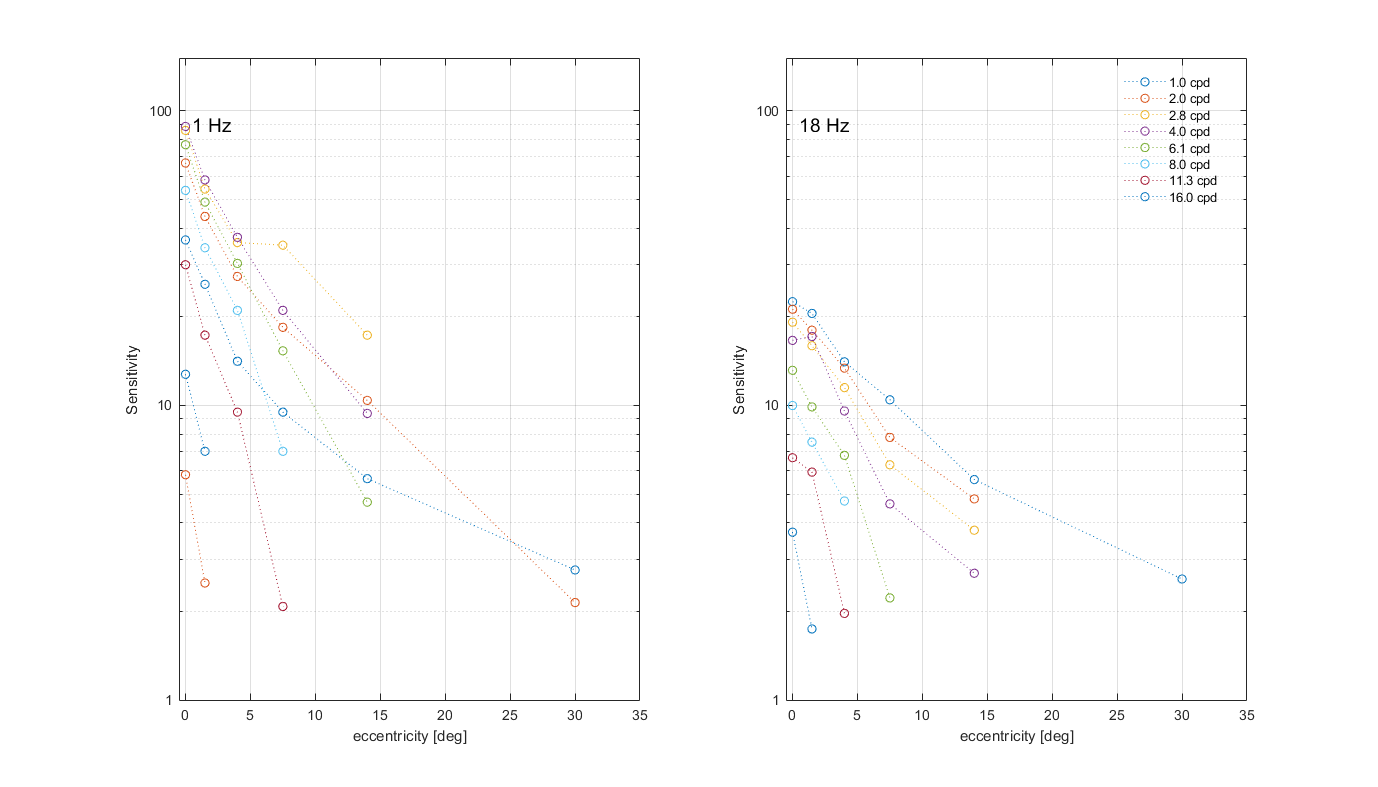
| virsu1982: Virsu et al. 1982 [paper] [data] [plot] | grating-semi-circular_aperture | 2AFC-detection | 72 | 1 | ✓ | 1, 2, 2.82843, 3.03143, 4, 6.06287, 8, 11.3137, 16, 22.6274 | 1, 18 | 10 | 0, 1.5, 4, 7.5, 14, 30 | 1 | 1 |
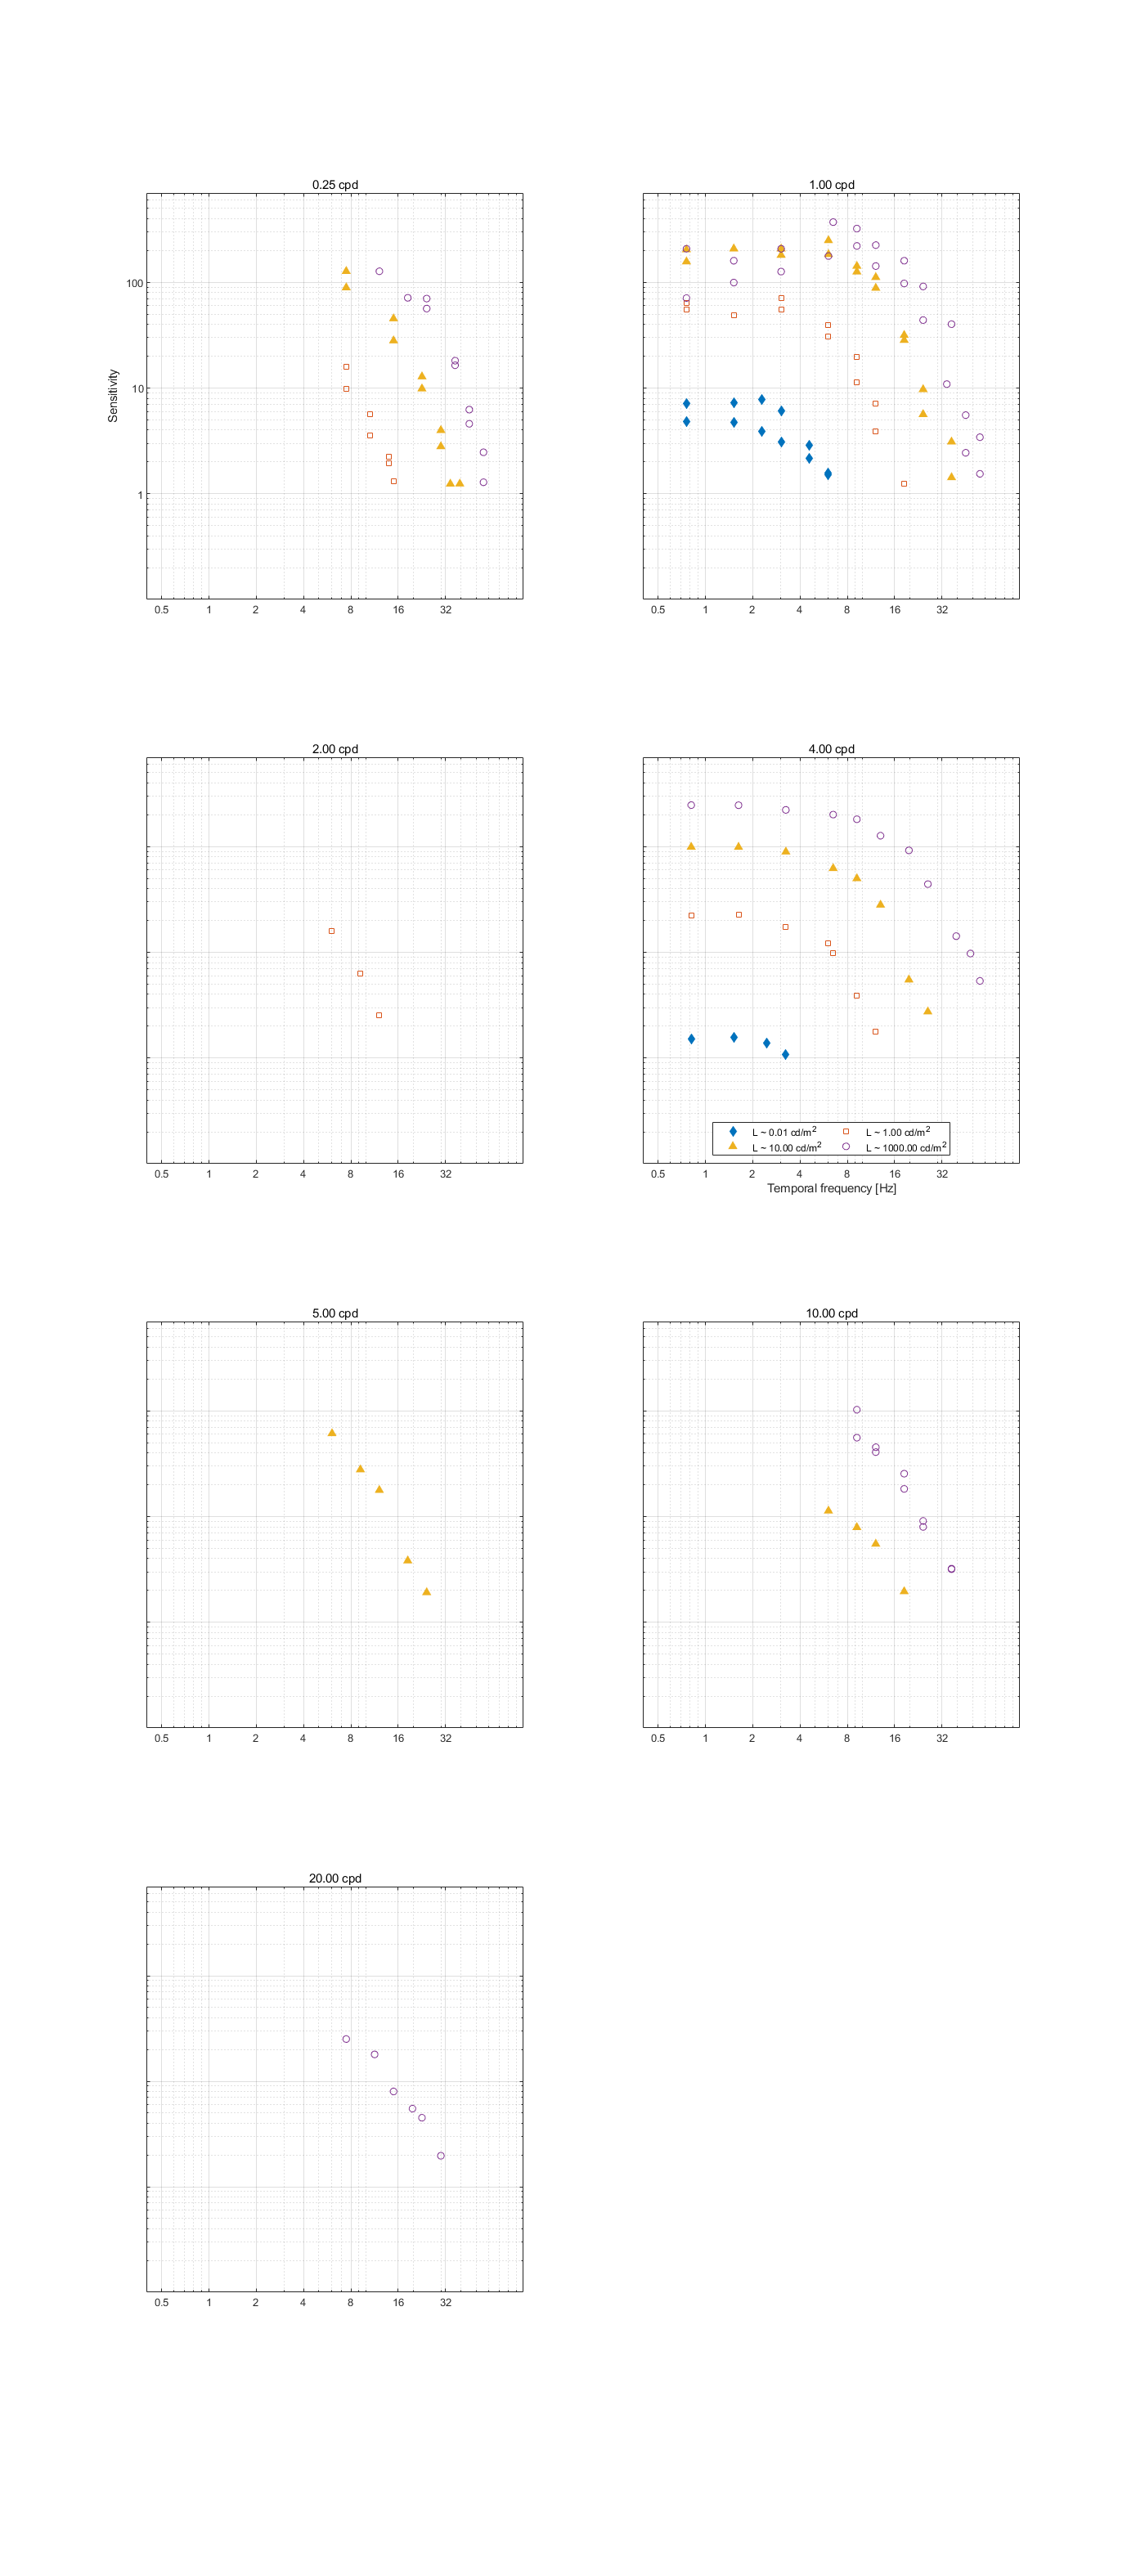
| snowden1995: Snowden et al. 1995 [paper] [data] [plot] | gabor | 2AFC-detection | 222 | 2 | ✓ | 0, 0.25, 1, 2, 4, 5, 10, 20 | 0.757858, 0.812252, 1.51572, 1.6245, 2.2974, 2.46229, 3.03143, 3.24901, 4.59479, 6.06287, 6.49802, 7.46426, 8, 9.18959, 10.5561, 11.3137, 12.1257, 12.996, 13.9288, 14.9285, 18.3792, 19.6983, 22.6274, 24.2515, 25.9921, 27.8576, 29.8571, 34.2968, 36.7583, 39.3966, 45.2548, 48.5029, 55.7152 | 0.021, 0.025, 0.55, 0.69, 17, 22, 660, 870 | 0 | 0.282095, 0.56419, 1.12979 | 1 |
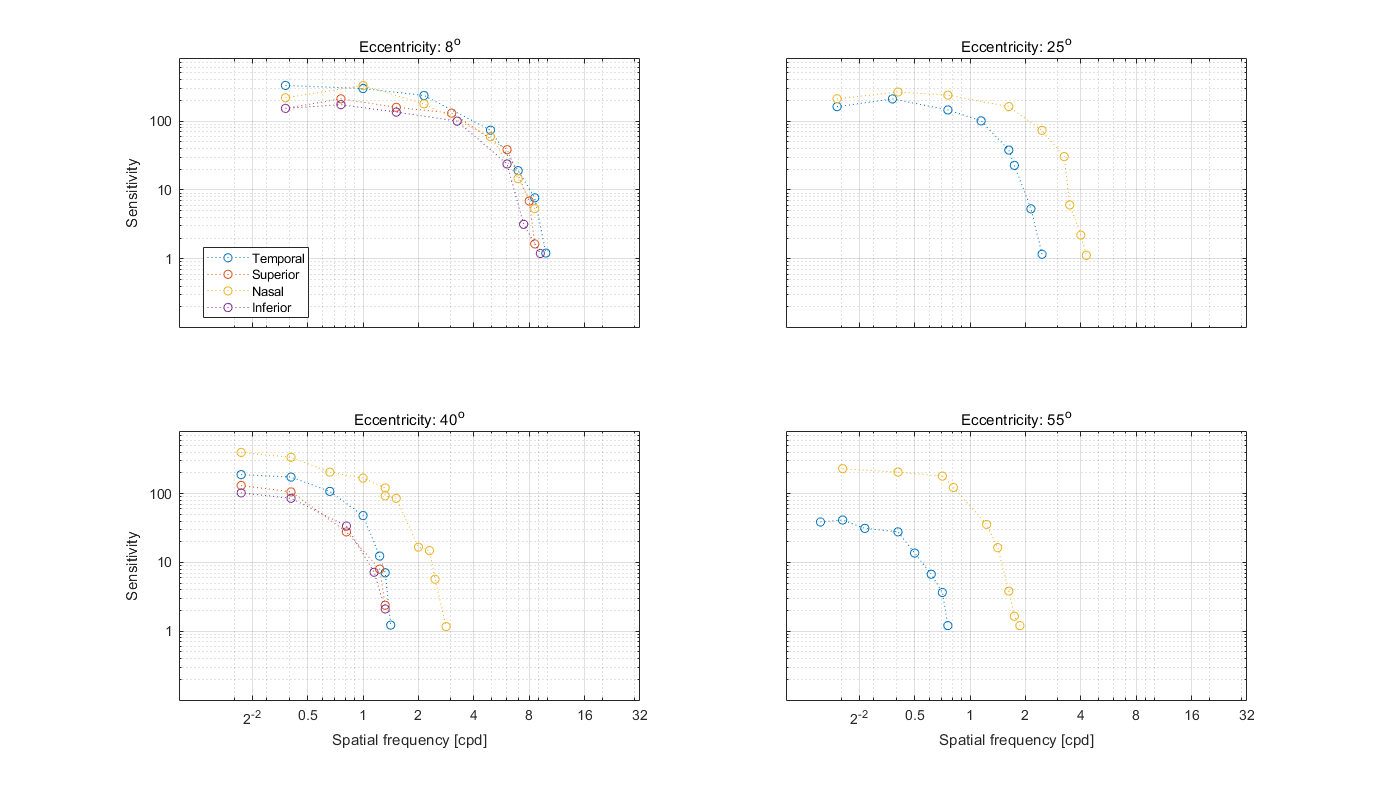
| anderson1991: Anderson et al. 1991 [paper] [data] [plot] | gabor | direction of motion discrimination | 89 | 1 | ✓ | 0.153893, 0.189465, 0.203063, 0.217638, 0.267943, 0.378929, 0.406126, 0.5, 0.615572, 0.659754, 0.707107, 0.757858, 0.812252, 1, 1.1487, 1.23114, 1.31951, 1.41421, 1.51572, 1.6245, 1.7411, 1.86607, 2, 2.14355, 2.2974, 2.46229, 2.82843, 3.03143, 3.24901, 3.4822, 4, 4.28709, 4.92458, 6.06287, 6.9644, 7.46426, 8, 8.57419, 9.18959, 9.84916 | 8 | 225 | 8, 25, 40, 55 | 0.5, 2.5 | 1 |
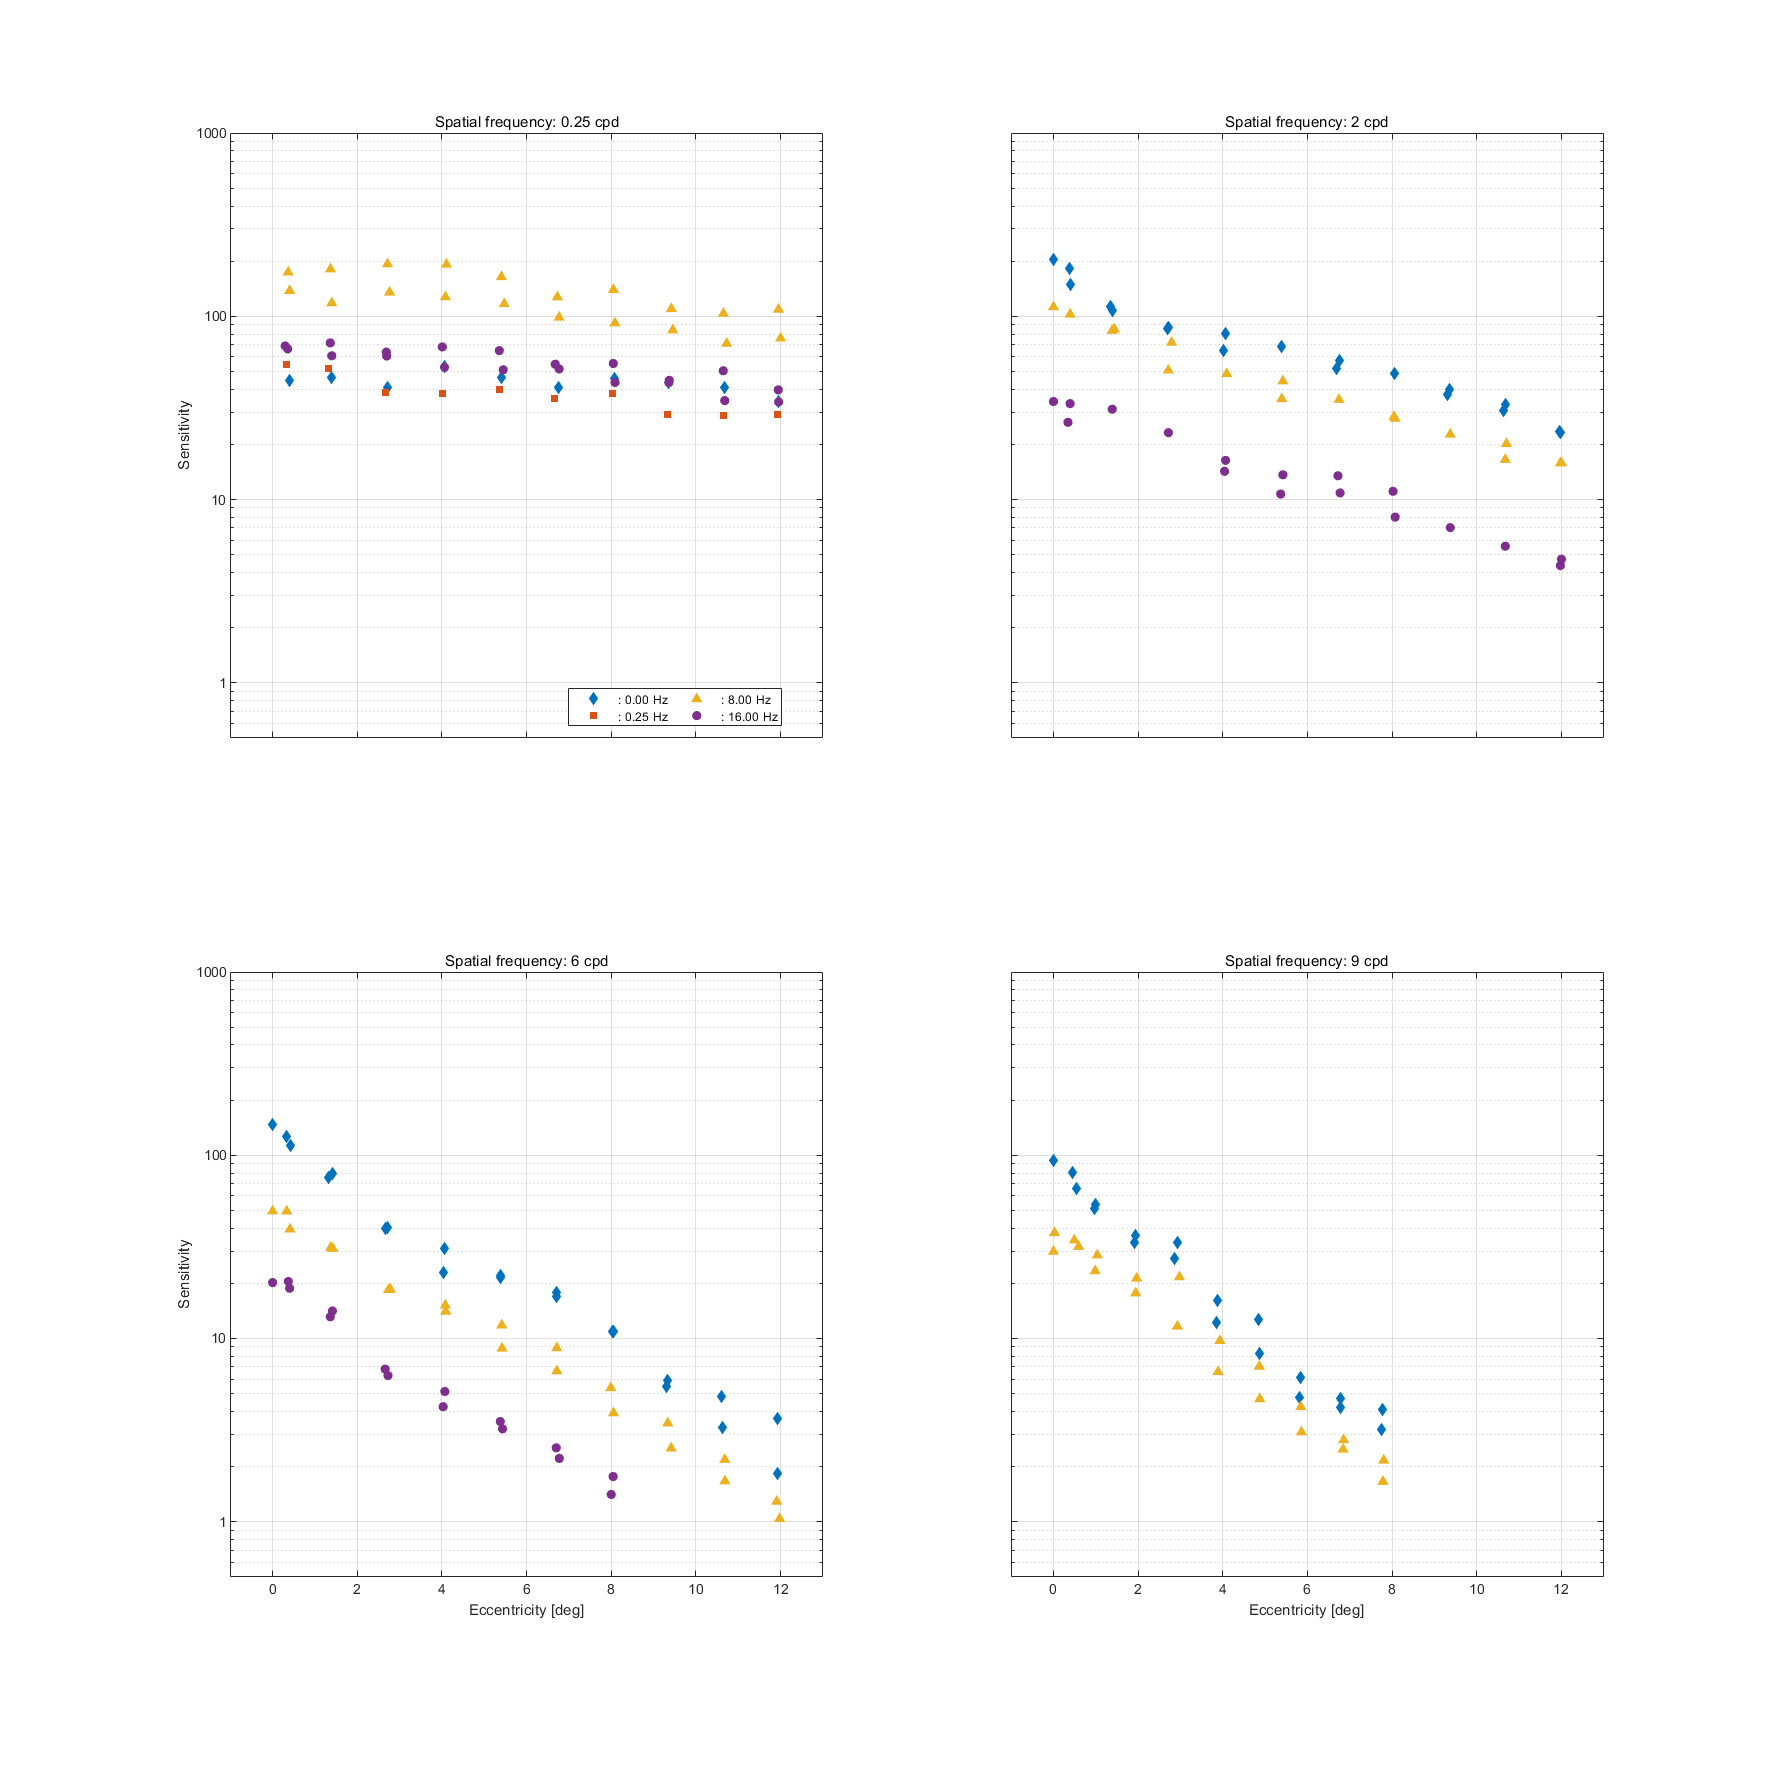
| wright1983: Wright and Johnson 1983 [paper] [data] [plot] | grating-tapered_rectangular_aperture | staircase method | 209 | 2 | ✓ | 0.25, 2, 6, 9 | 0, 0.25, 8, 16 | 100 | 0, 0.0259179, 0.295599, 0.317861, 0.319908, 0.33392, 0.341837, 0.356481, 0.367347, 0.368969, 0.372216, 0.392857, 0.402778, 0.402871, 0.410465, 0.421272, 0.440605, 0.492441, 0.543103, 0.594828, 0.958963, 0.982759, 0.984881, 1.03448, 1.30987, 1.31575, 1.33673, 1.36291, 1.36345, 1.36719, 1.37186, 1.38776, 1.39815, 1.40819, 1.4141, 1.42213, 1.43878, 1.91793, 1.93966, 1.94384, 1.96552, 2.65946, 2.66073, 2.67766, 2.686, 2.68878, 2.69444, 2.71368, 2.71429, 2.71759, 2.72208, 2.72653, 2.74082, 2.76389, 2.7848, 2.79082, 2.85097, 2.92241, 2.92873, 2.97414, 3.86177, 3.87931, 3.88769, 3.93103, 4.00694, 4.00928, 4.01531, 4.02901, 4.04082, 4.04632, 4.06019, 4.06364, 4.06633, 4.06883, 4.07993, 4.08333, 4.08873, 4.09184, 4.10631, 4.83621, 4.86207, 4.87257, 5.35337, 5.35532, 5.36735, 5.37273, 5.37779, 5.38089, 5.39286, 5.40278, 5.40548, 5.41396, 5.41837, 5.41872, 5.43193, 5.44907, 5.47222, 5.81897, 5.83153, 5.84483, 5.85745, 6.65271, 6.67765, 6.69388, 6.69723, 6.69946, 6.70141, 6.71297, 6.71432, 6.71939, 6.72748, 6.7449, 6.74537, 6.76852, 6.77041, 6.77248, 6.77586, 6.7905, 6.84233, 6.85345, 7.75862, 7.77538, 7.78448, 7.8013, 7.98879, 7.99869, 8.01982, 8.02041, 8.02241, 8.04372, 8.04592, 8.04713, 8.05087, 8.0519, 8.06242, 8.06481, 8.07143, 8.08796, 9.29592, 9.31593, 9.32114, 9.32972, 9.33493, 9.34694, 9.36111, 9.36929, 9.37245, 9.4153, 9.41934, 9.4537, 10.6013, 10.6224, 10.6376, 10.6441, 10.6464, 10.6493, 10.6735, 10.6806, 10.6809, 10.6846, 10.699, 10.7269, 11.9084, 11.9191, 11.9208, 11.9351, 11.9452, 11.949, 11.9493, 11.9537, 11.9745, 11.9766, 12 | 0.99, 1.75, 3 | 1 |
Data from Figure 2 in the paper, only for vertical gratings, square apertures (observer OL).
Data for stimuli 1-14, which contain Gabor patches of fixed size or fixed number of cycles.
The data was imported from Fig. 7 in the paper. The background colour was assumed to be D65.
Data from Fig. 2C in the paper - Detection (of a grating with circular aperture).
The data was imported from both the figures in the paper. Since no spectral information was given, we assumed a white P4 CRT.
The data was imported from Figures 1 and 11 in the paper. We have assumed an achromatic stimuli. The original stimulus in the paper is isoluminant for rods. Hence, we will not consider lower luminance data from this work.
The data was imported from Figure 1, 2 in the paper. The threshold was measured as the contrast where the direction of drifting of the stimulus grating was no longer discernible. The eccentricity directions in the retinal field are encoded as; temporal: 0, superior: 90, nasal: 180, and inferior: 270.
Data points from figures 1, 2, 4, and 5 are extracted. The apparatus uses a green P31 phosphor but since we are only interested in the luminance profile, we assume a D65 background modulated along achromatic direction. A rectangular tapered grating is used. The variable ge_sigma represents the longer dimension of the stimulus.