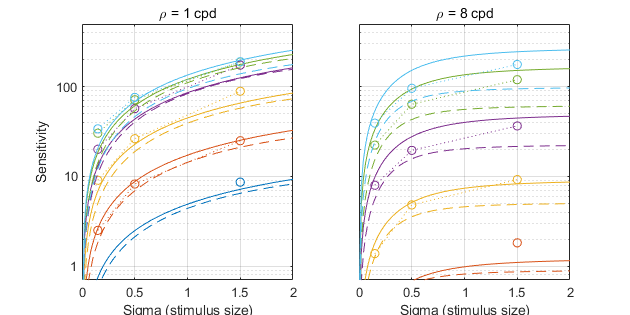
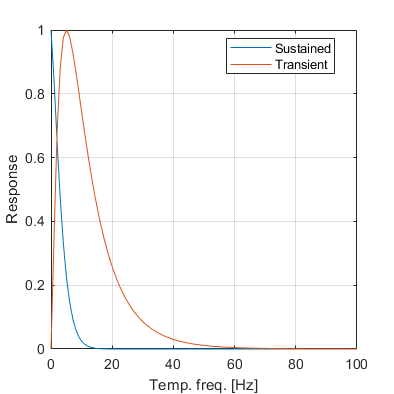
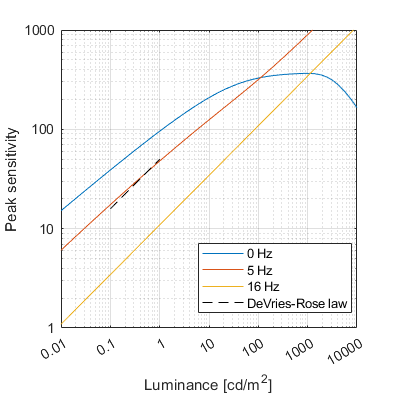
Sustained and transient response
| Dataset | Fitting error | Sensitivity adjustment | ||
| stelaCSF | FovVideoVDP CSF | stelaCSF | FovVideoVDP CSF | |
| Average training | 4.15 [dB] | 9.15 [dB] | N/A | N/A |
| modelfest | 3.05 [dB] | 6.04 [dB] | 1.000 | 1.000 |
| hdrvdp_csf | 3.69 [dB] | 5.18 [dB] | 1.283 | 1.310 |
| hdr_csf | 3.54 [dB] | 5.60 [dB] | 0.694 | 0.945 |
| rovamo1993 | 2.79 [dB] | 6.62 [dB] | 1.472 | 1.956 |
| robson1966 | 2.80 [dB] | 10.43 [dB] | 0.970 | 0.651 |
| laird2006 | 5.41 [dB] | 6.20 [dB] | 0.801 | 1.002 |
| snowden1995 | 5.04 [dB] | 14.38 [dB] | 0.641 | 0.305 |
| virsu1979 | 6.84 [dB] | 9.26 [dB] | 1.072 | 1.170 |
| virsu1982 | 5.69 [dB] | 8.89 [dB] | 1.175 | 1.072 |
| wright1983 | 2.71 [dB] | 7.15 [dB] | 0.678 | 0.502 |
| anderson1991 | 6.90 [dB] | 11.83 [dB] | 2.938 | 1.793 |
| Model | Sum of Square Errors (SS) | Degrees of freedom (df) | F-test | AIC | |
| F-statistic | p-value | ||||
| stelaCSF (Reference Model) | 41.769 | 826 | N/A | N/A | -2527.24 |
| FovVideoVDP CSF | 199.958 | 845 | 164.644 | 0.0000 ✓ | -1223.22 |
We use AIC and F-test to test whether the difference in fitting error is statistically significant at alpha=0.05 level. Both statistical metrics take the number of optimized parameters into account.
F-test: For F-test, we compare the fitting results from stelaCSF with those of other models. The F-static is calculated using the residual sum of squares and degrees of freedom (number of data points - number of optimized parameters) from both models. The corresponding p-value indicates whether or not the null hypothesis is rejected, where H0: the stelaCSF does not provide significant better fit than the other model. The p-values less than 0.05 indicates that stelaCSF provides a better fit to the data at the significance level of 0.05 (marked with ✓). We performed the F-test for all individual datasets as well as for all datasets combined. For smaller datasets, where the number of data points are comparable to the number of model parameters, F-test can not provide any results since it indicates there is more variance within the models' fits than between.
AIC: Akaike information criterion is a statistical estimator of prediction error and relative quality of the models, which accounts for the number of parameters of each model. The model with the lower AIC score is considered to be better and with a good balance of error value and the number of parameters.
The sensitivity adjustment column contains a multiplier that is used to adjust the sensitivity of each datasets. It corresponds to sd in the paper (Eq. 18).
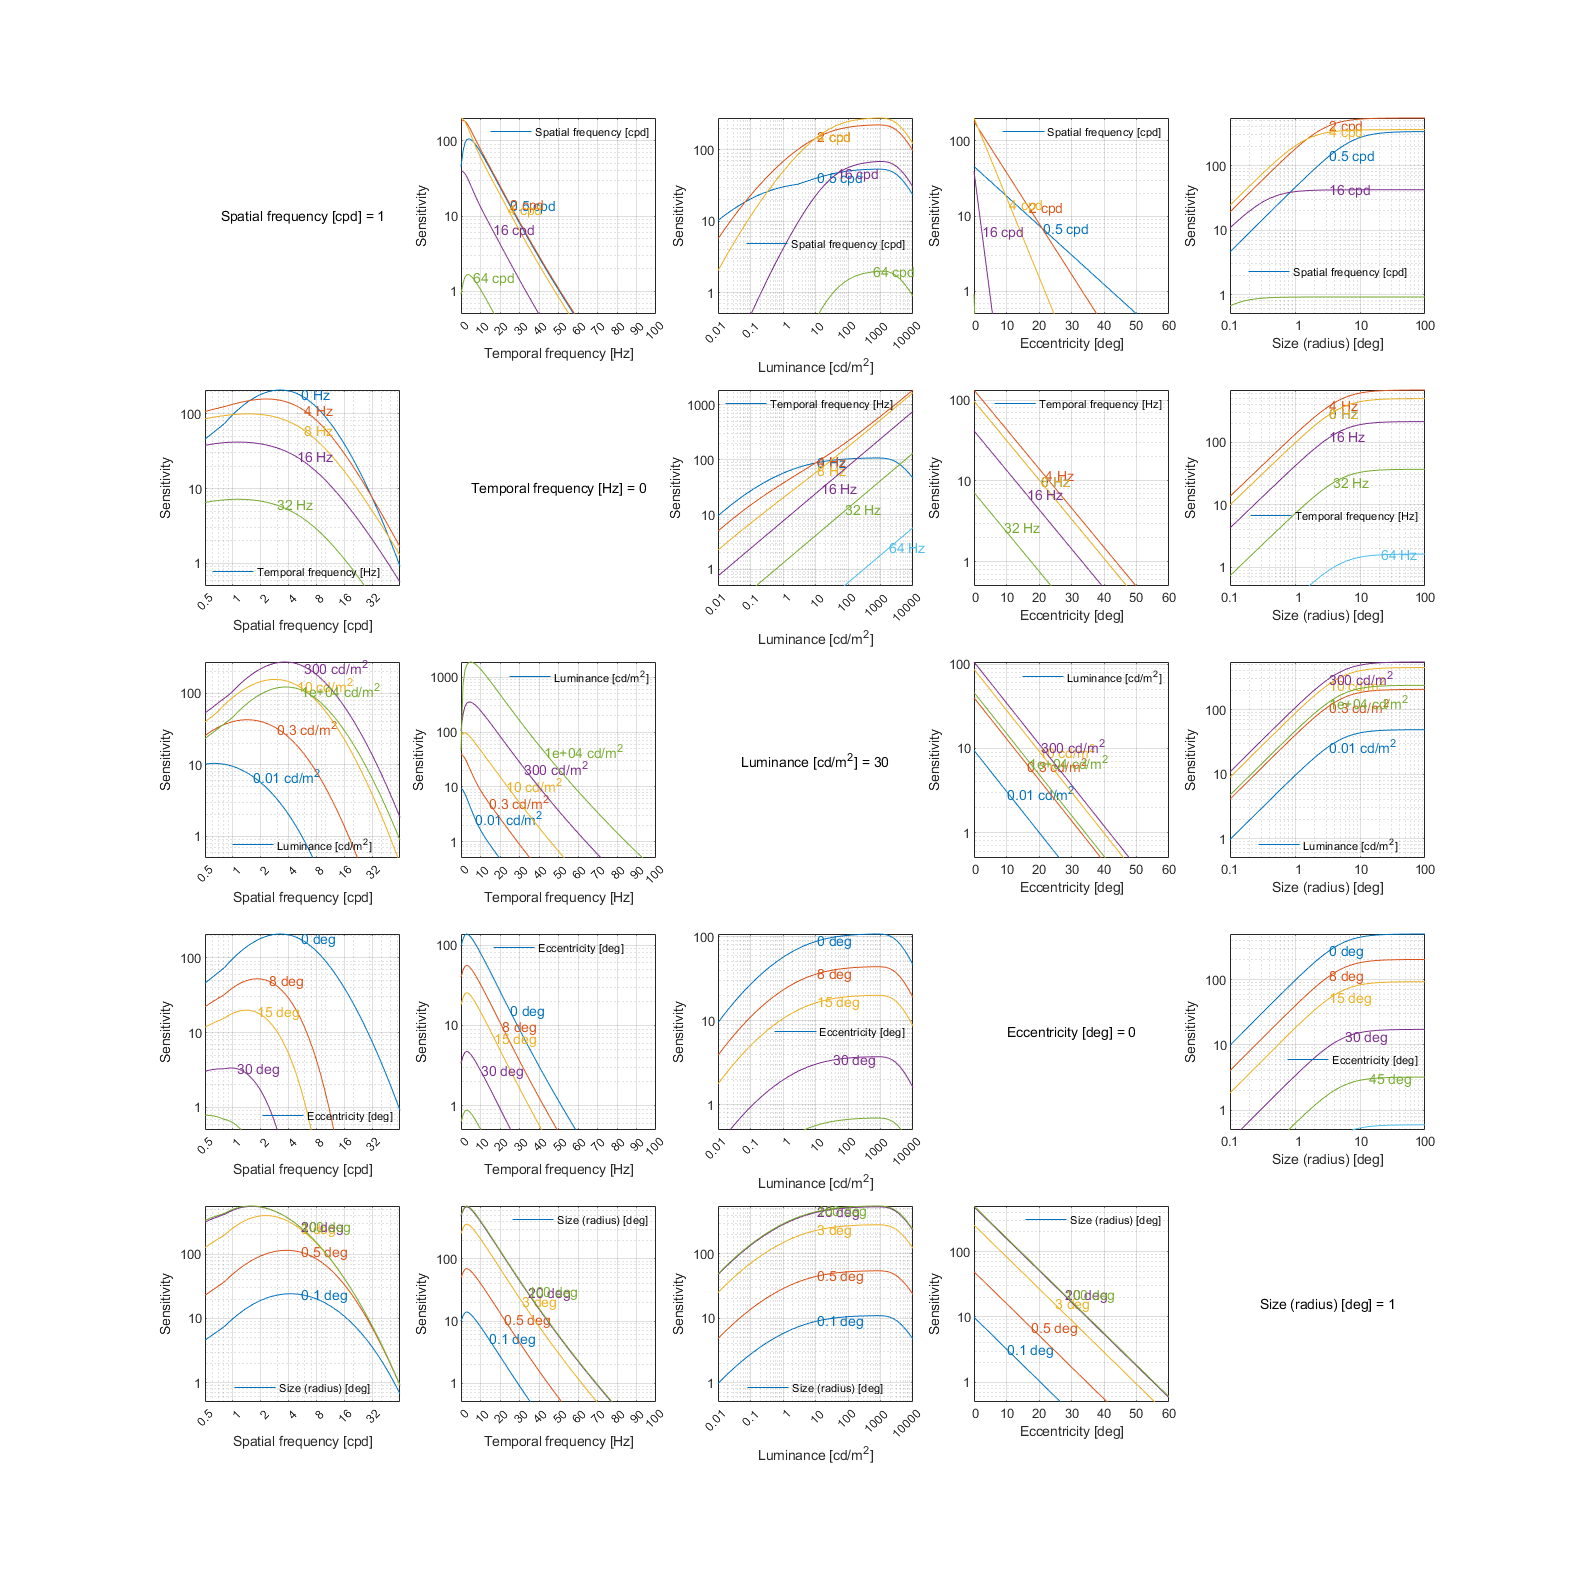
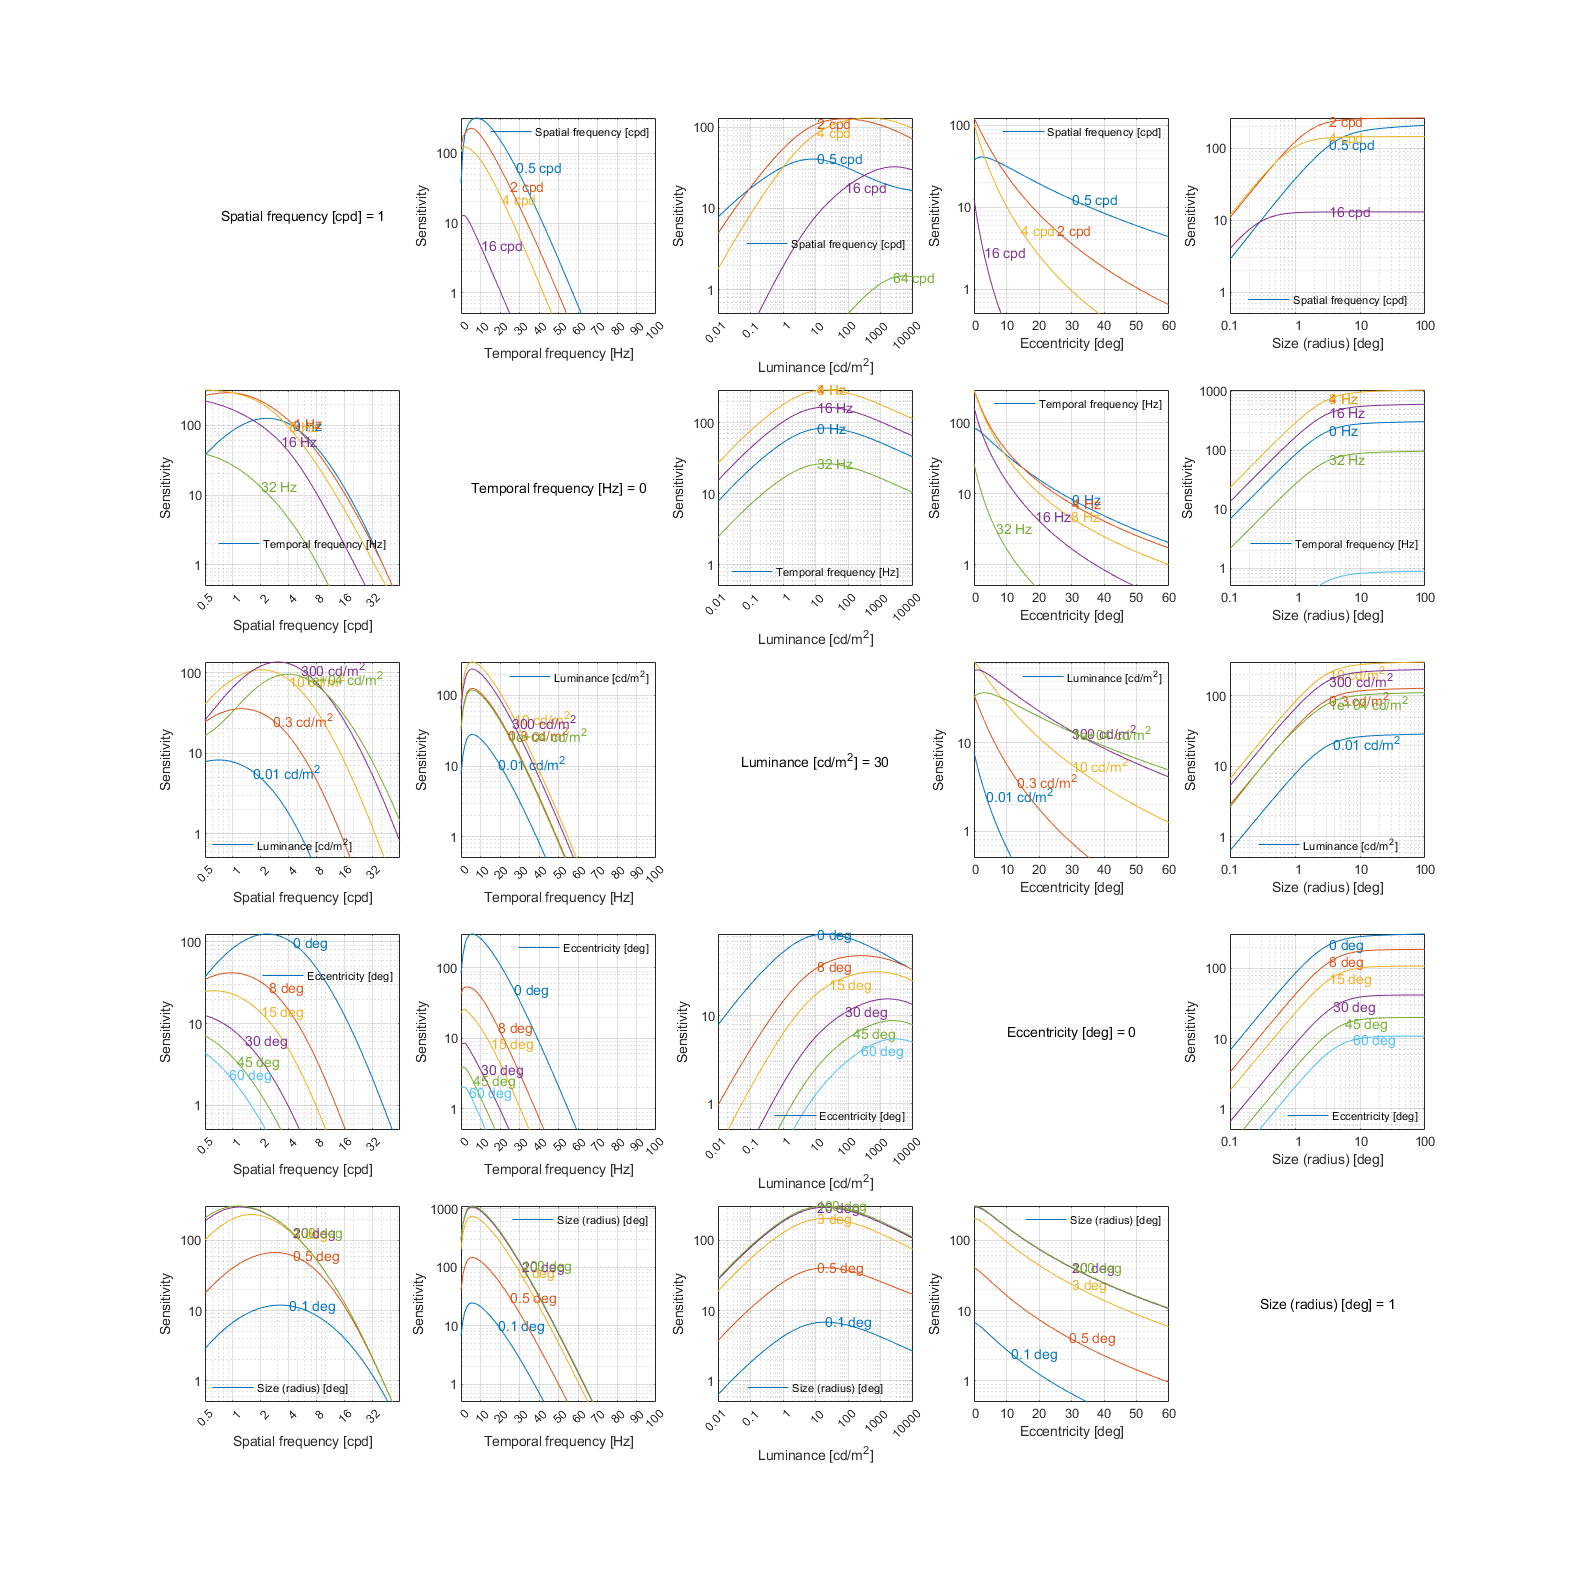
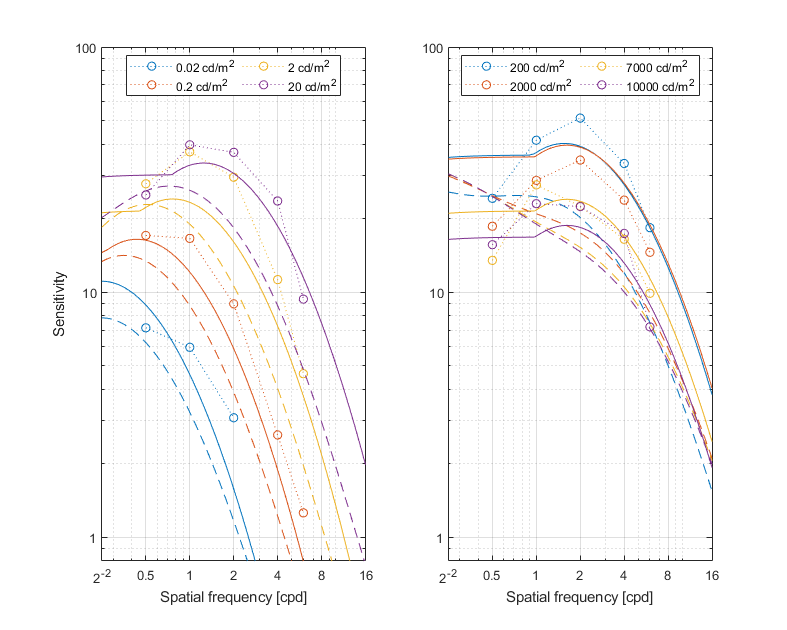
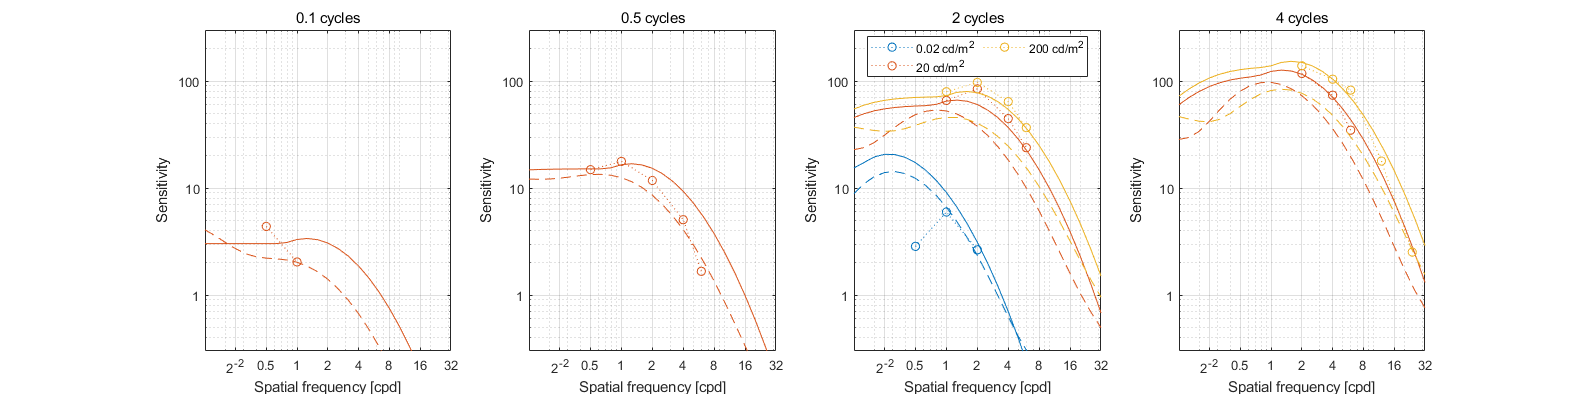
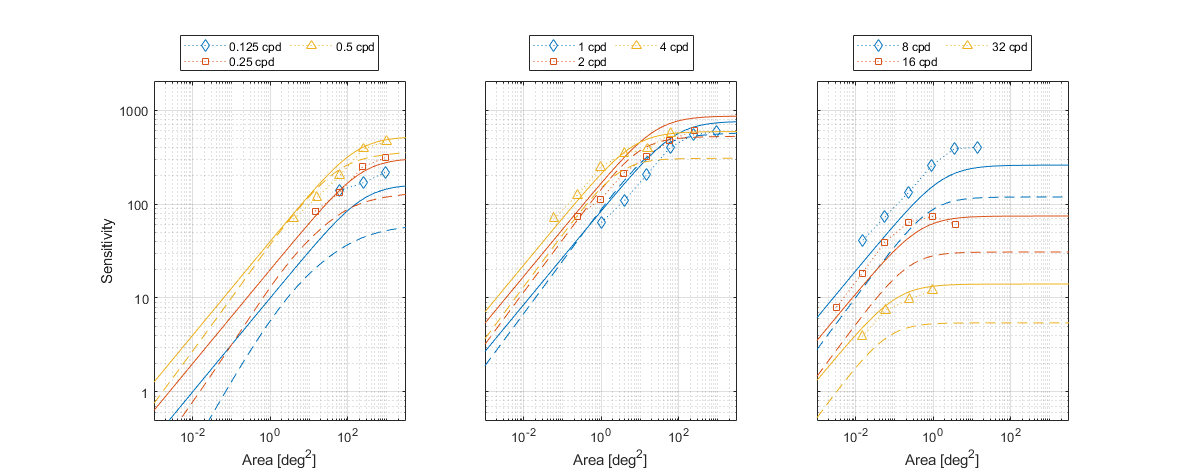
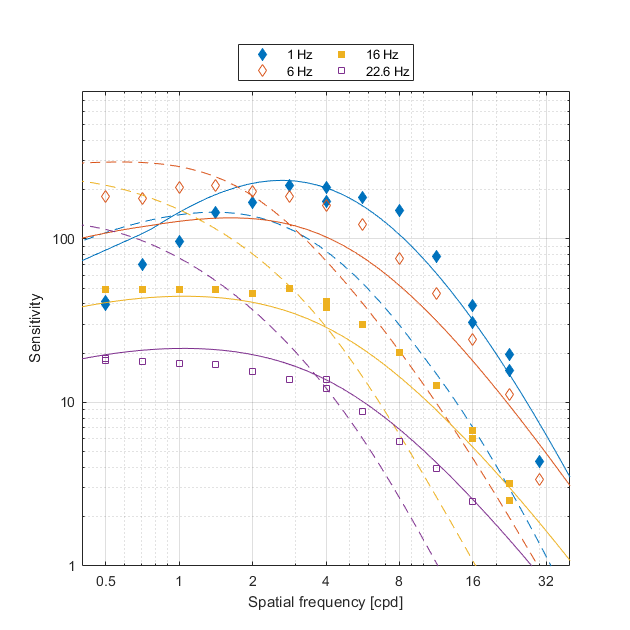
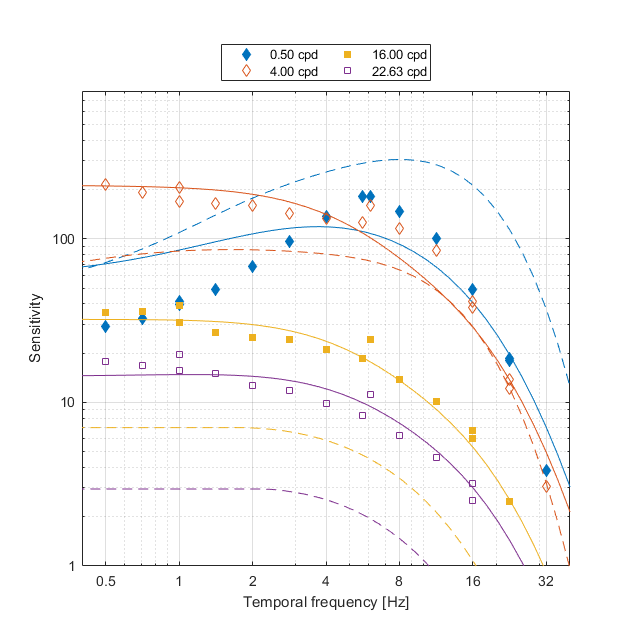
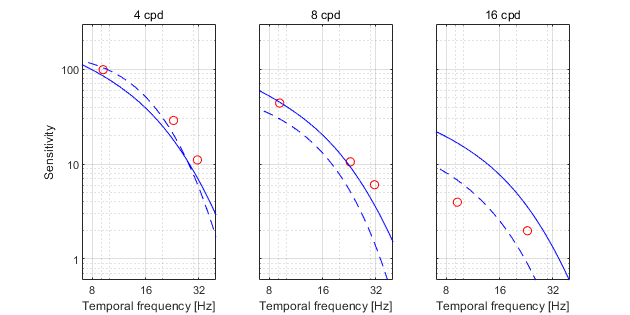
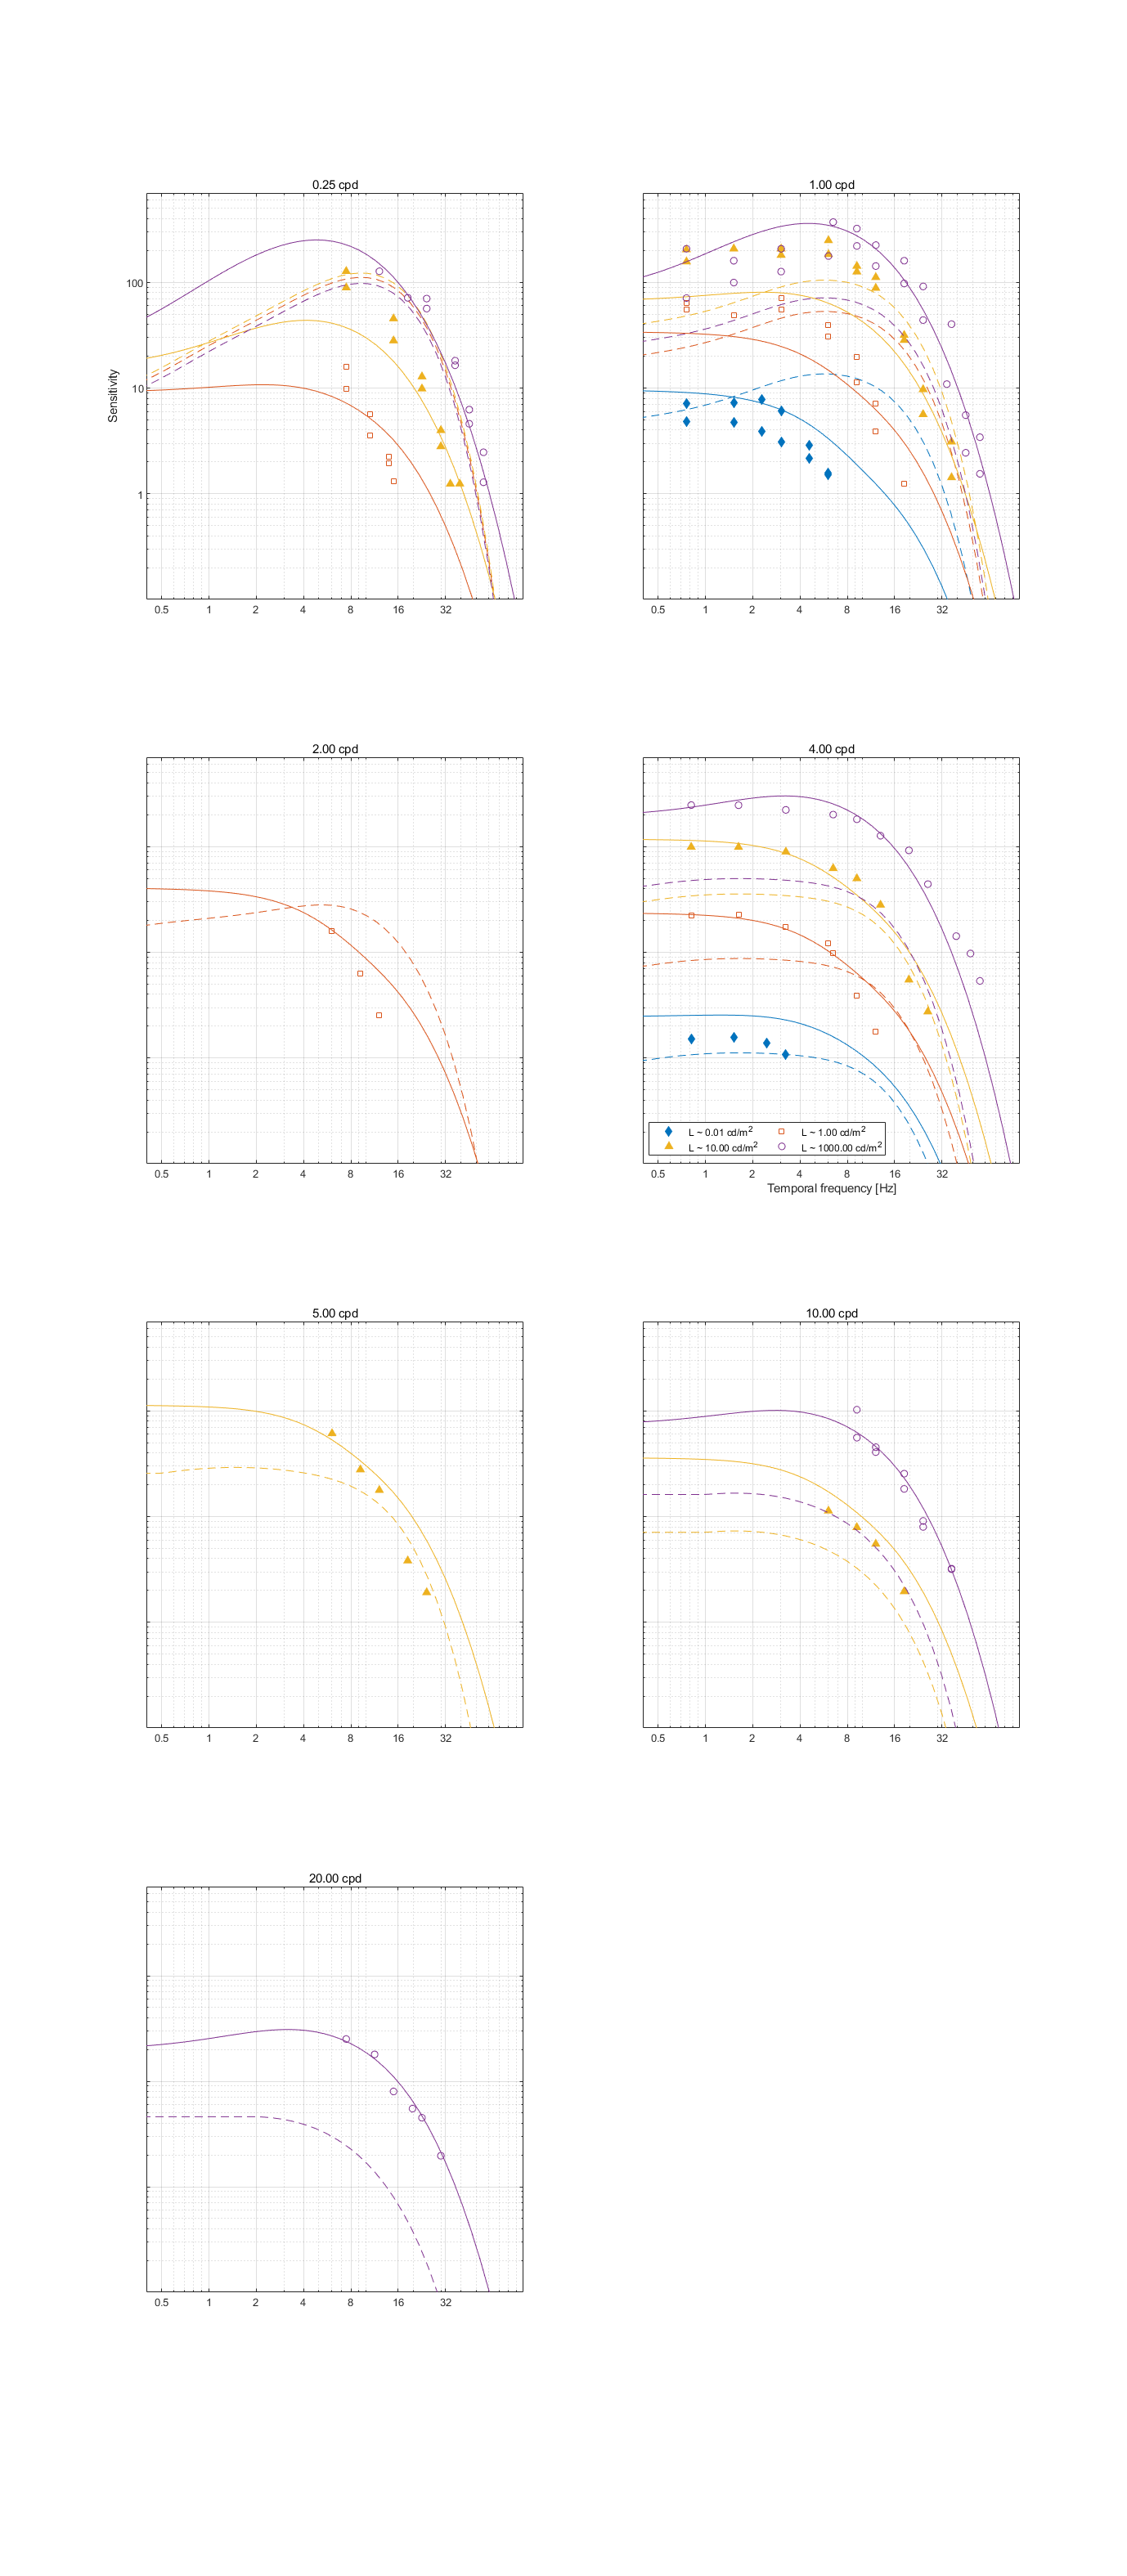
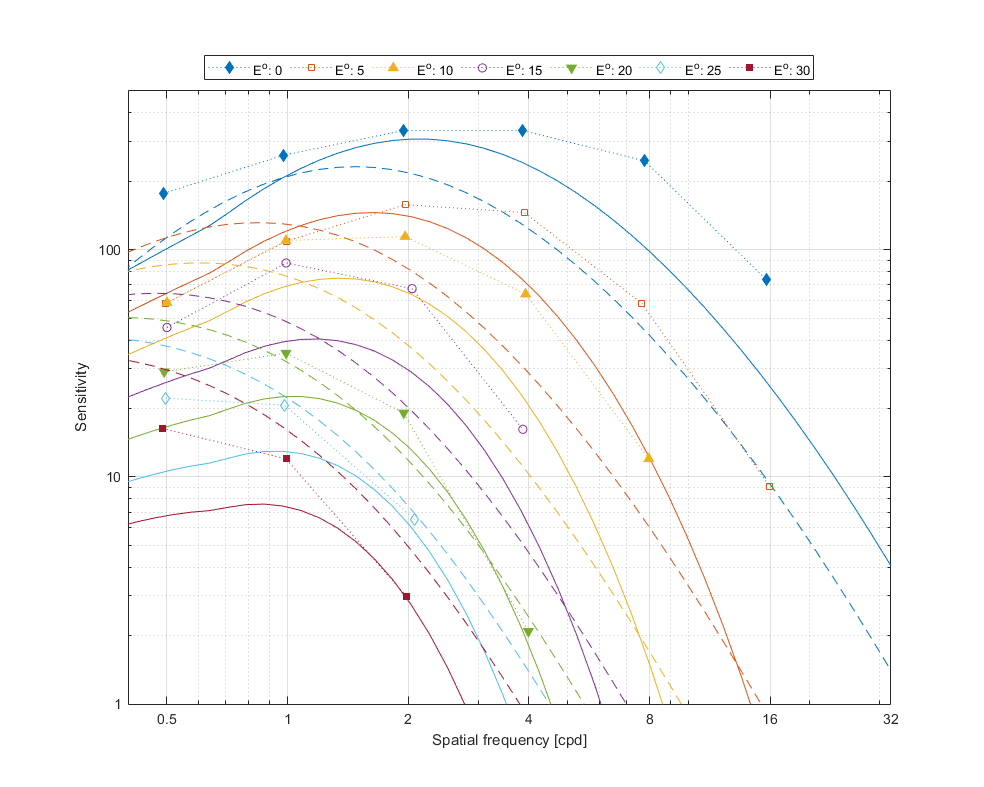
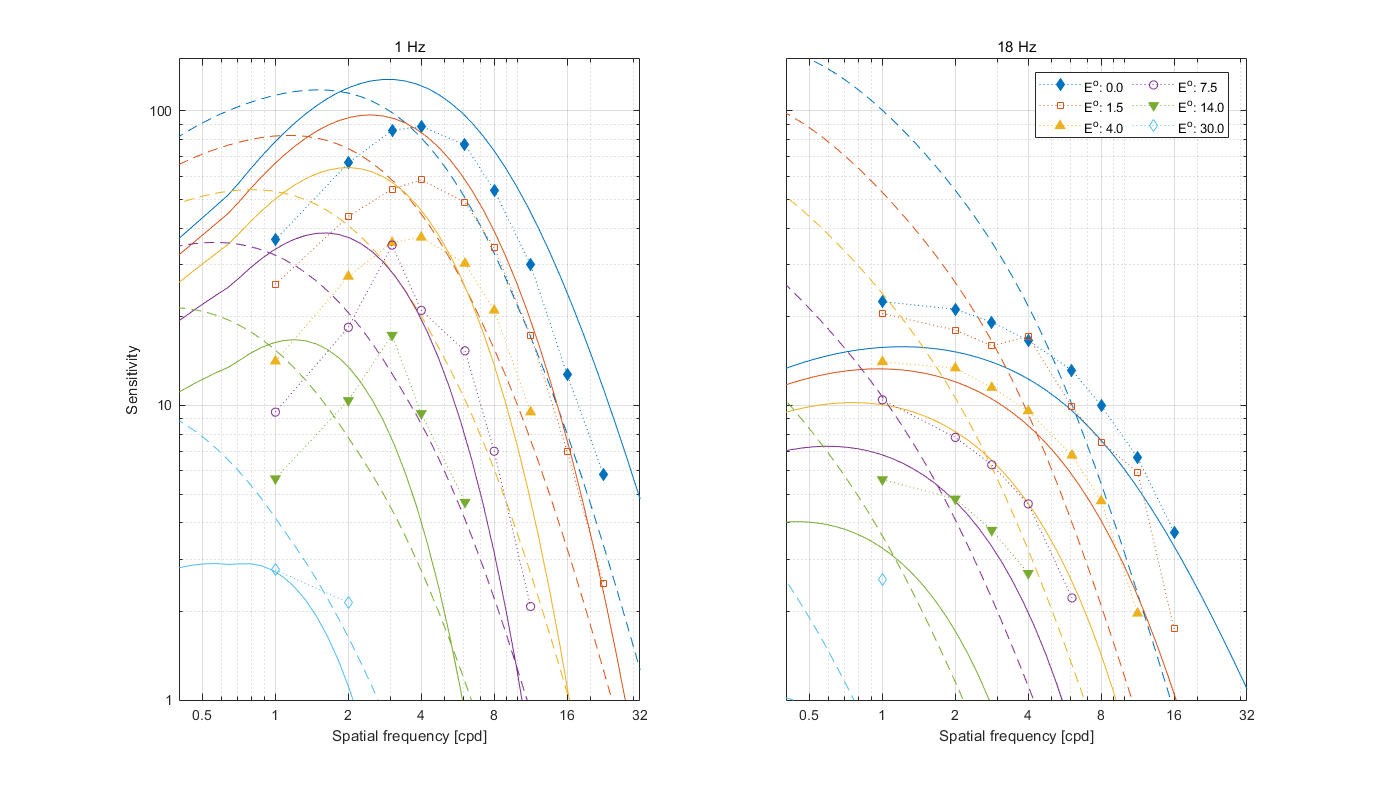
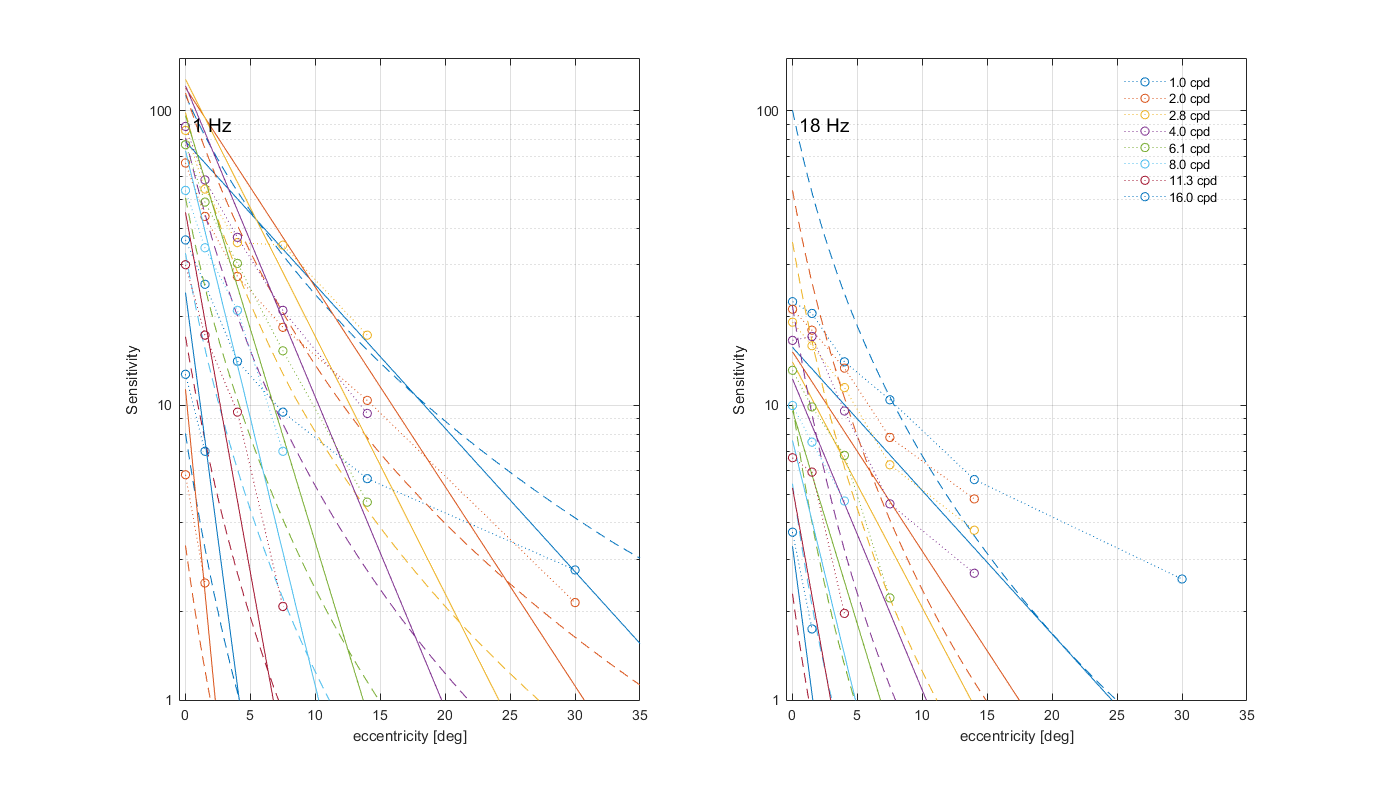
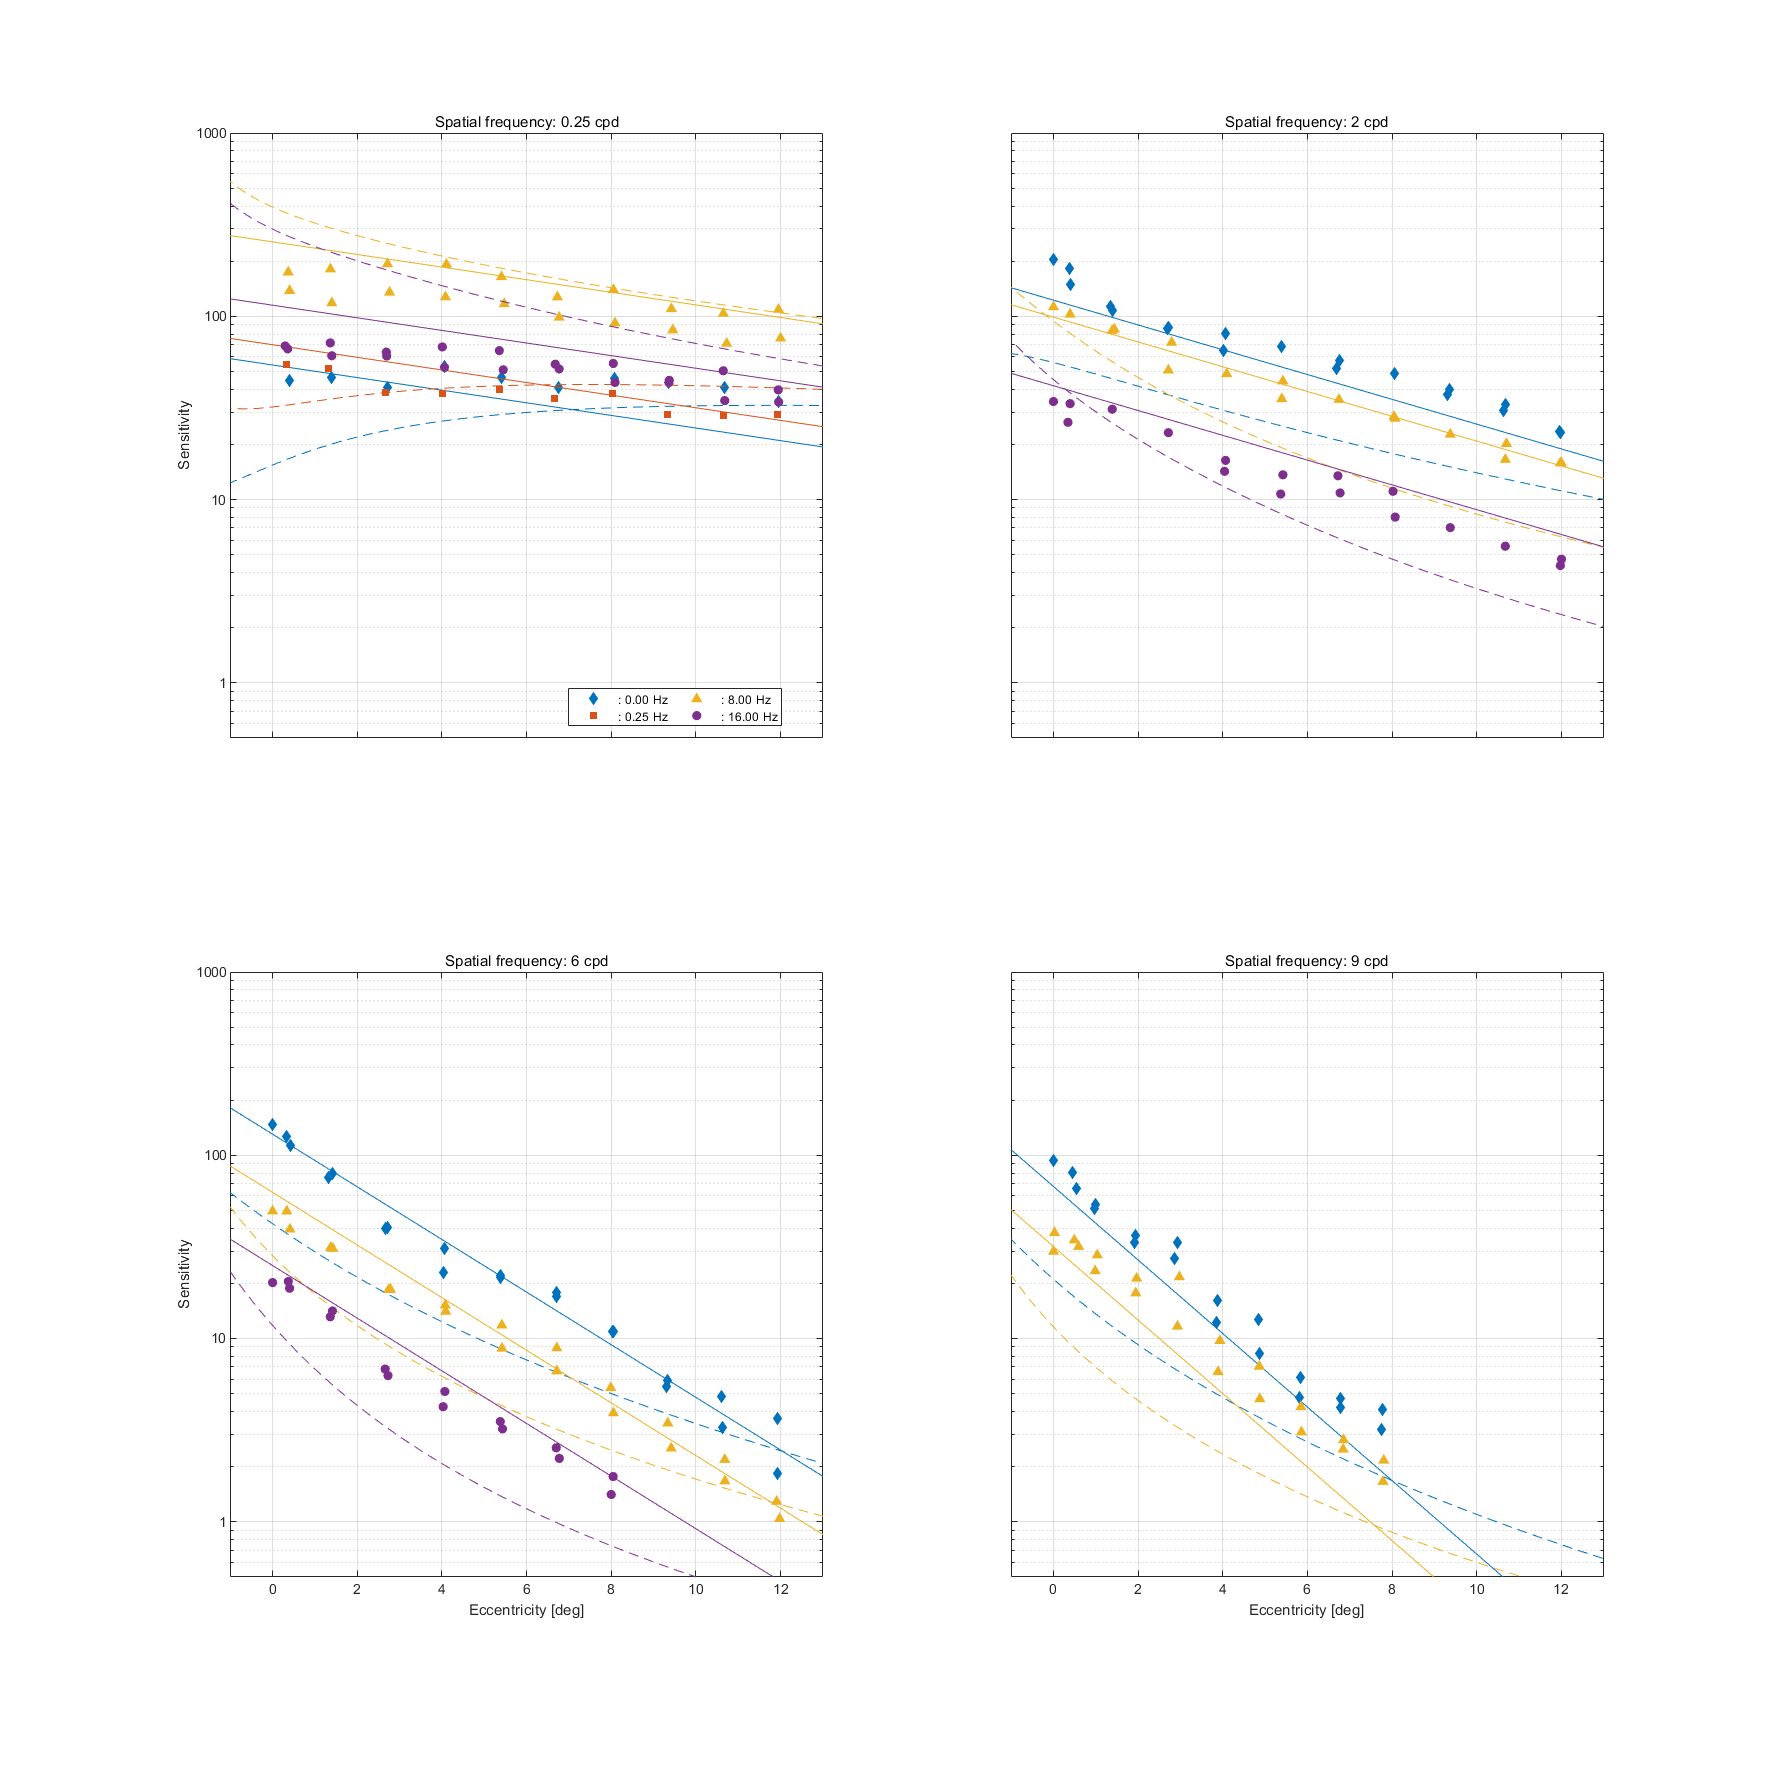
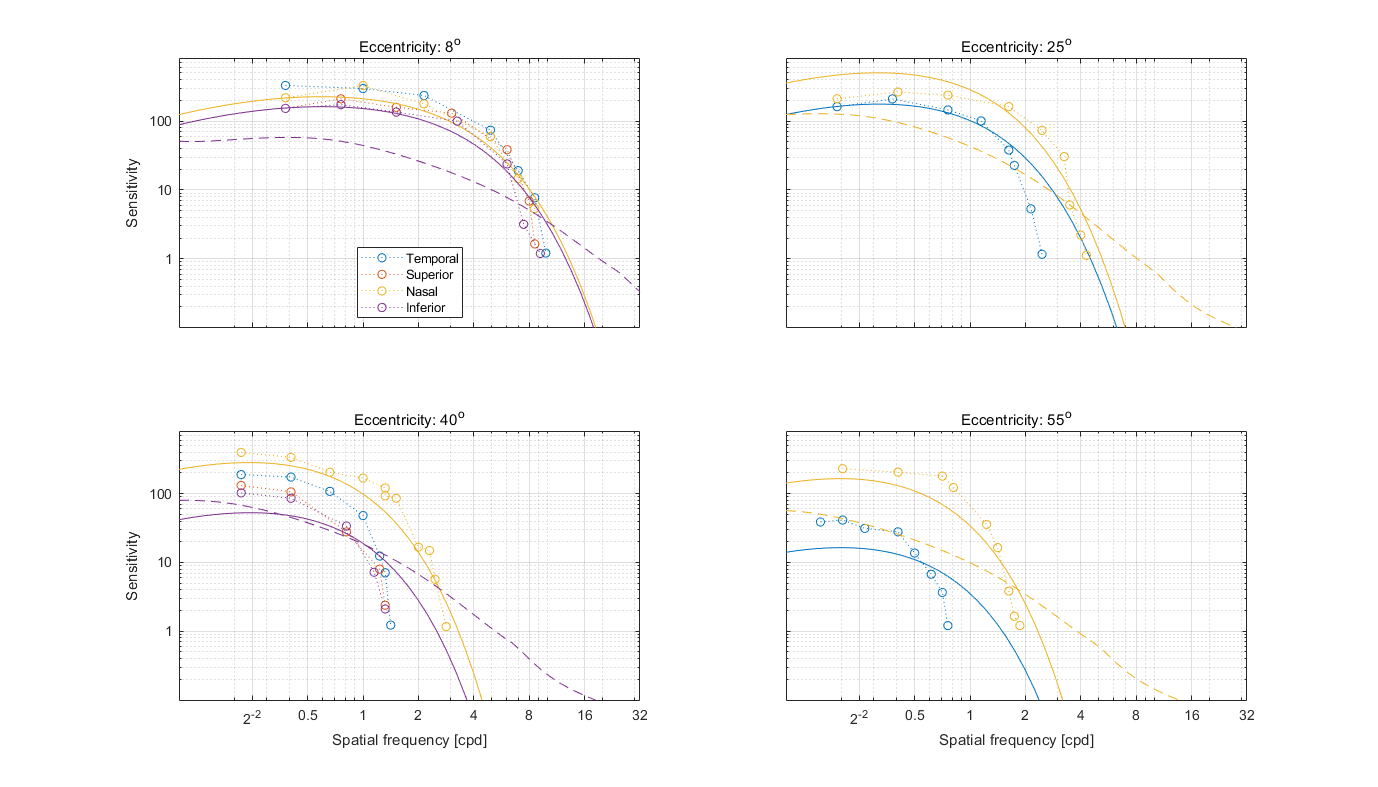
To keep the plots legible, only up to 3 models are plotted.