FovVideoVDP
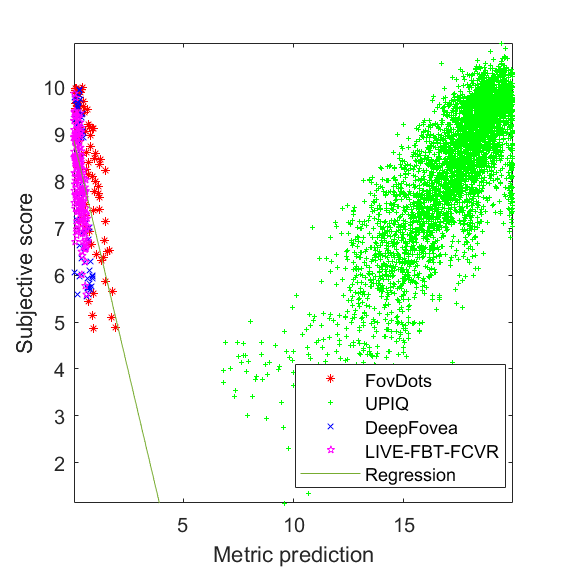
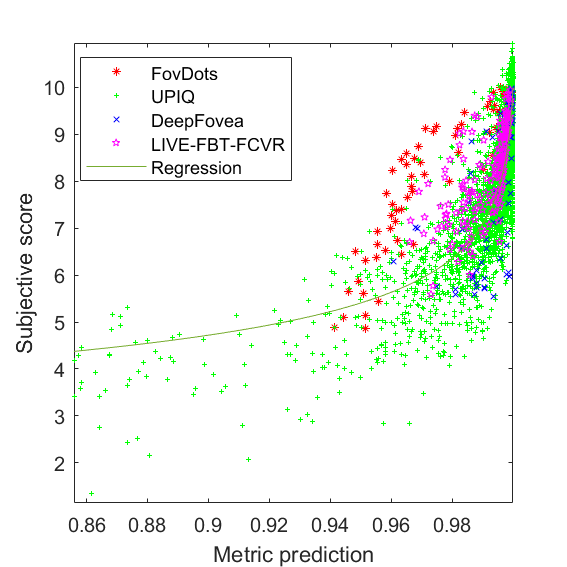
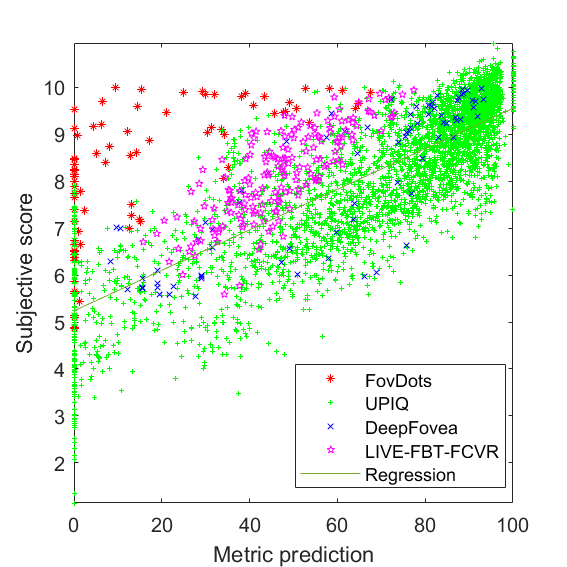
RMSE = 0.7962 PLCC = 0.8697 SROCC = 0.8492Detailed report for:FovDotsUPIQDeepFoveaLIVE-FBT-FCVR
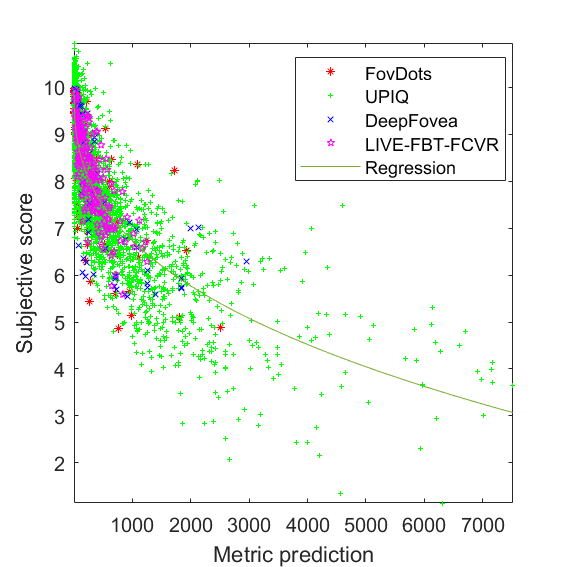 JOD regression: Q = 10 -0.249449 * M^0.372455
The results are reported for the testing portion of the dataset: randomly selected 80% of the conditions. The remaining 20% was used to calibrate FovVideoVDP parameters. The testing set was used to fit JOD regression (JOD regression is not a part of training). The scatter plots and detailed reports (if present) show the entire dataset.
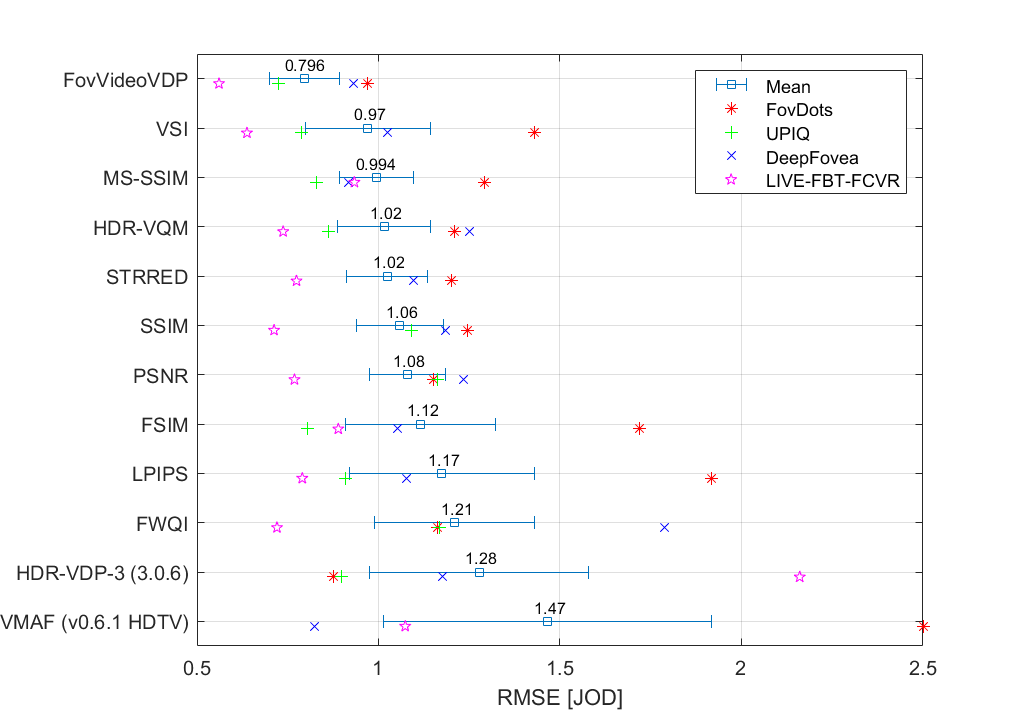
| Metric/Variant | RMSE | PLCC | SROCC | ||||||||||||
| FovDots | UPIQ | DeepFovea | LIVE-FBT-FCVR | Average(1) | FovDots | UPIQ | DeepFovea | LIVE-FBT-FCVR | Average(2) | FovDots | UPIQ | DeepFovea | LIVE-FBT-FCVR | Average(3) | |
| FovVideoVDP → | 0.9703 | 0.7232 | 0.9308 | 0.5606 | 0.7962 | 0.722 | 0.8745 | 0.8136 | 0.7999 | 0.8697 | 0.769 | 0.8493 | 0.8423 | 0.7913 | 0.8492 |
| VSI → | 1.429 | 0.7884 | 1.025 | 0.6377 | 0.9702 | 0.7481 | 0.851 | 0.828 | 0.8489 | 0.8395 | 0.7702 | 0.8289 | 0.7966 | 0.8525 | 0.8257 |
| MS-SSIM → | 1.292 | 0.8304 | 0.9185 | 0.9336 | 0.9937 | 0.7563 | 0.8389 | 0.8412 | 0.8011 | 0.8249 | 0.7835 | 0.8334 | 0.8378 | 0.8085 | 0.8239 |
| HDR-VQM → | 1.21 | 0.8626 | 1.251 | 0.7374 | 1.015 | 0.6954 | 0.8154 | 0.761 | 0.6684 | 0.8045 | 0.7402 | 0.7675 | 0.7412 | 0.6749 | 0.7613 |
| STRRED → | 1.201 | NaN | 1.097 | 0.7741 | 1.024 | 0.8104 | NaN | 0.8214 | 0.6532 | 0.5948 | 0.8266 | NaN | 0.8248 | 0.656 | 0.6126 |
| SSIM → | 1.247 | 1.092 | 1.184 | 0.7123 | 1.059 | 0.6073 | 0.6842 | 0.7945 | 0.6579 | 0.6798 | 0.6112 | 0.7134 | 0.779 | 0.6663 | 0.7129 |
| PSNR → | 1.152 | 1.163 | 1.235 | 0.7684 | 1.079 | 0.5801 | 0.6255 | 0.723 | 0.5917 | 0.6229 | 0.5577 | 0.6702 | 0.7152 | 0.5583 | 0.6662 |
| FSIM → | 1.719 | 0.8032 | 1.052 | 0.8892 | 1.116 | 0.7475 | 0.8595 | 0.7492 | 0.7615 | 0.8385 | 0.8632 | 0.8032 | 0.7429 | 0.7742 | 0.7937 |
| LPIPS → | 1.919 | 0.9093 | 1.078 | 0.7899 | 1.174 | 0.6385 | 0.7937 | 0.7927 | 0.8451 | 0.7716 | 0.6671 | 0.7722 | 0.7834 | 0.8442 | 0.7554 |
| FWQI → | 1.161 | 1.169 | 1.789 | 0.7203 | 1.21 | 0.6324 | 0.6216 | 0.02874 | 0.7606 | 0.6085 | 0.6621 | 0.6291 | 0.2125 | 0.7448 | 0.6191 |
| HDR-VDP-3 (3.0.6) → | 0.8748 | 0.8969 | 1.176 | 2.16 | 1.277 | 0.8553 | 0.8129 | 0.692 | 0.7161 | 0.7432 | 0.8615 | 0.8084 | 0.6881 | 0.747 | 0.7799 |
| VMAF (v0.6.1 HDTV) → | 2.5 | NaN | 0.8232 | 1.074 | 1.466 | 0.657 | NaN | 0.8648 | 0.7919 | 0.7841 | 0.7381 | NaN | 0.861 | 0.79 | 0.7784 |
(1)Average RMSE is computed as an average of RMSEs of individual datasets so that each dataset has the same influence on the average RMSE regardless of the number of conditions it contains.
(2-3)Average correlation coeffcients are computed for the consolidated dataset consisting of all four individual datasets. It means that the average correlation coefficients are dominated by the performance on UPIQ, which contains over 4000 conditions. For that reason, RMSE is more indicative of metric performance.
Detailed report for:FovDotsUPIQDeepFoveaLIVE-FBT-FCVR
JOD regression: Q = 10 -0.249449 * M^0.372455
Detailed report for:FovDotsUPIQDeepFoveaLIVE-FBT-FCVR
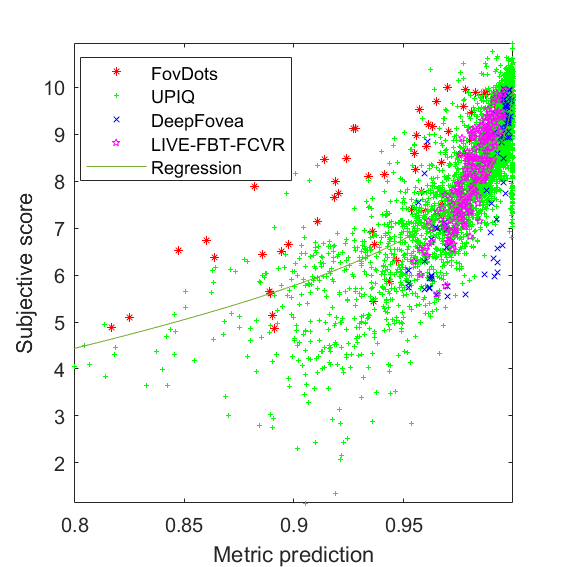 JOD regression: Q = -120.401 * z^0.0301661 + 10, z=log2(1.001-M)
Detailed report for:FovDotsUPIQDeepFoveaLIVE-FBT-FCVR
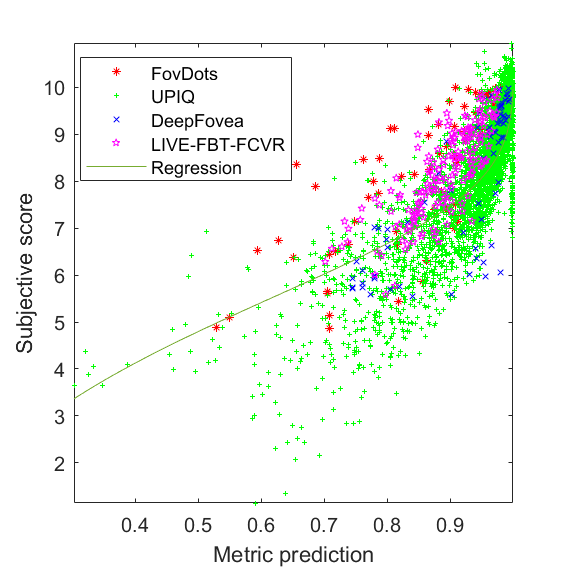 JOD regression: Q = -102.849 * z^0.0214474 + 10, z=log2(1.001-M)
Detailed report for:FovDotsUPIQDeepFoveaLIVE-FBT-FCVR
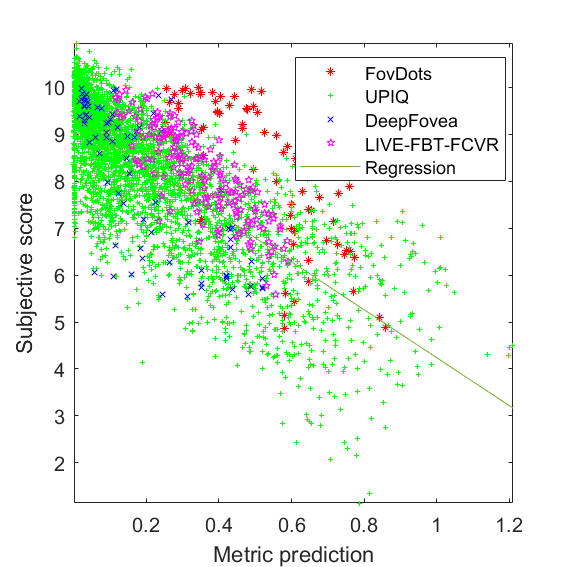
 JOD regression: Q = -1.98843 * M + 8.91004
Detailed report for:FovDotsUPIQDeepFoveaLIVE-FBT-FCVR
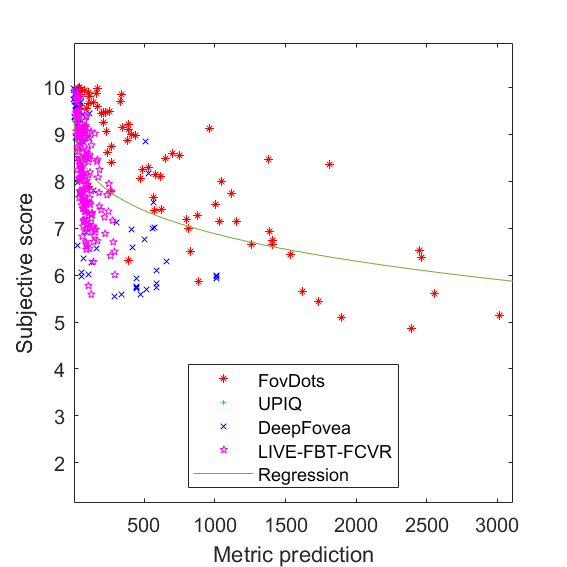 JOD regression: Q = 10 -0.564865 * M^0.247371
Detailed report for:FovDotsUPIQDeepFoveaLIVE-FBT-FCVR
 JOD regression: Q = -83.2433 * z^0.0157508 + 10, z=log2(1.001-M)
Detailed report for:FovDotsUPIQDeepFoveaLIVE-FBT-FCVR
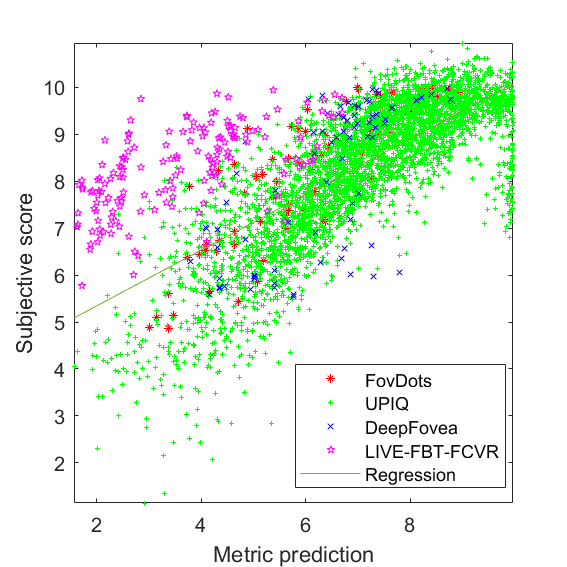
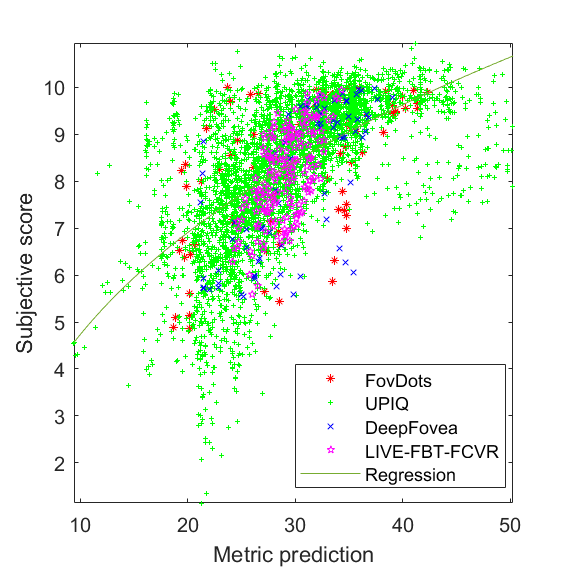 metric to JOD mapping params: Q = 4.06072 * M^0.325177 + -3.84643
Detailed report for:FovDotsUPIQDeepFoveaLIVE-FBT-FCVR
 JOD regression: Q = -0.399536 * z^1.24912 + 10, z=log2(1.001-M)
Detailed report for:FovDotsUPIQDeepFoveaLIVE-FBT-FCVR
 JOD regression: Q = -5.10424 * M + 9.34396
Detailed report for:FovDotsUPIQDeepFoveaLIVE-FBT-FCVR
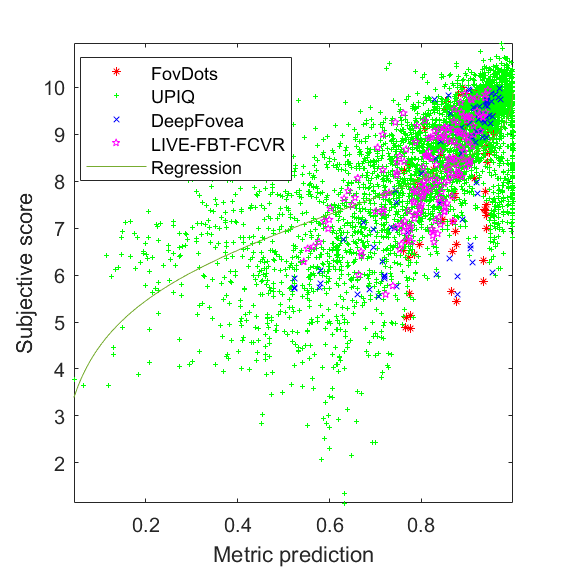
 JOD regression: Q = -4.42667*|1-M|^0.589672 + 10
Detailed report for:FovDotsUPIQDeepFoveaLIVE-FBT-FCVR
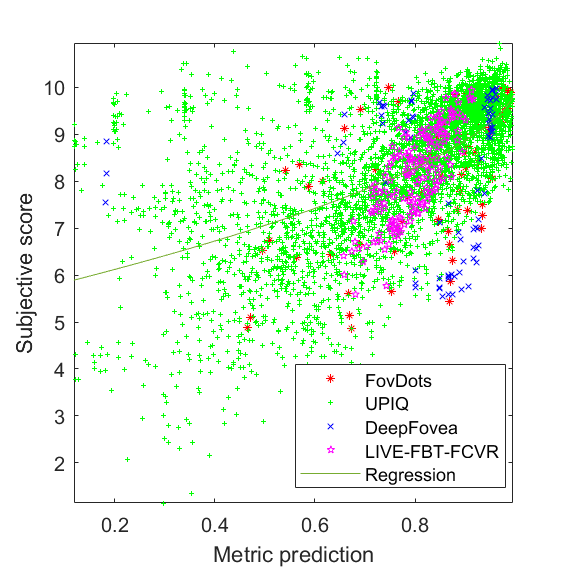
 JOD regression: Q = 0.593624 * M + 4.15607
Detailed report for:FovDotsUPIQDeepFoveaLIVE-FBT-FCVR
 JOD regression: Q = 0.0431542 * M + 5.23811