FovVideoVDP masking
RMSE = 0.8319 PLCC = 0.837 SROCC = 0.8104Detailed report for:FovDotsUPIQDeepFoveaLIVE-FBT-FCVR
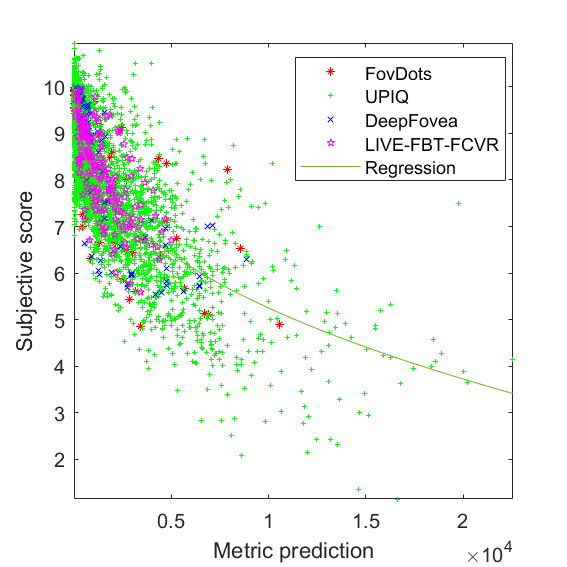 JOD regression: Q = 10 -0.11692 * M^0.402183
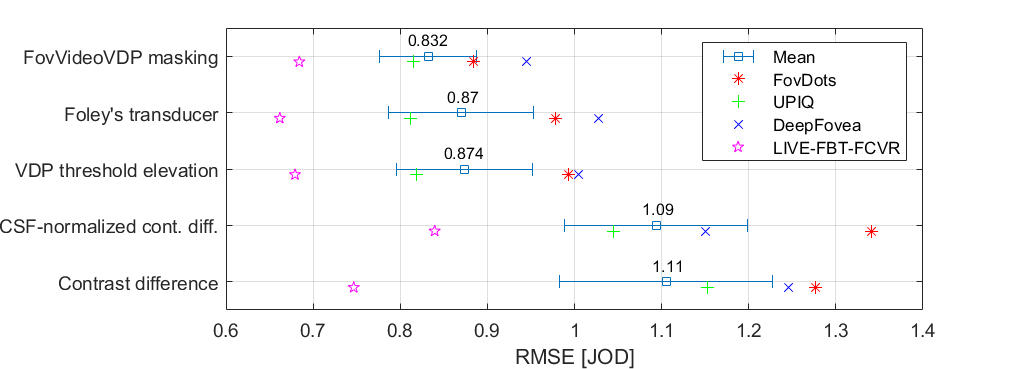
| Metric/Variant | RMSE | PLCC | SROCC | ||||||||||||
| FovDots | UPIQ | DeepFovea | LIVE-FBT-FCVR | Average(1) | FovDots | UPIQ | DeepFovea | LIVE-FBT-FCVR | Average(2) | FovDots | UPIQ | DeepFovea | LIVE-FBT-FCVR | Average(3) | |
| FovVideoVDP masking → | 0.8837 | 0.8147 | 0.9449 | 0.6841 | 0.8319 | 0.7938 | 0.8409 | 0.8262 | 0.7113 | 0.837 | 0.8284 | 0.8112 | 0.8401 | 0.711 | 0.8104 |
| Foley's transducer → | 0.9778 | 0.8119 | 1.028 | 0.6618 | 0.8698 | 0.7794 | 0.8436 | 0.8178 | 0.7732 | 0.839 | 0.8313 | 0.8373 | 0.8115 | 0.7662 | 0.8353 |
| VDP threshold elevation → | 0.9931 | 0.8184 | 1.004 | 0.6792 | 0.8737 | 0.7564 | 0.8394 | 0.8086 | 0.6917 | 0.834 | 0.788 | 0.8011 | 0.8288 | 0.6867 | 0.7989 |
| CSF-normalized cont. diff. → | 1.341 | 1.044 | 1.15 | 0.8395 | 1.094 | 0.6376 | 0.7216 | 0.8255 | 0.7579 | 0.7117 | 0.6245 | 0.7121 | 0.8014 | 0.7521 | 0.7044 |
| Contrast difference → | 1.277 | 1.152 | 1.245 | 0.7466 | 1.105 | 0.6325 | 0.6522 | 0.7262 | 0.6456 | 0.6483 | 0.608 | 0.7108 | 0.7223 | 0.6455 | 0.7062 |
(1)Average RMSE is computed as an average of RMSEs of individual datasets so that each dataset has the same influence on the average RMSE regardless of the number of conditions it contains.
(2-3)Average correlation coeffcients are computed for the consolidated dataset consisting of all four individual datasets. It means that the average correlation coefficients are dominated by the performance of UPIQ, which contains over 4000 conditions. For that reason, RMSE is more indicative of metric performance.
Detailed report for:FovDotsUPIQDeepFoveaLIVE-FBT-FCVR
JOD regression: Q = 10 -0.11692 * M^0.402183
Detailed report for:FovDotsUPIQDeepFoveaLIVE-FBT-FCVR
Detailed report for:FovDotsUPIQDeepFoveaLIVE-FBT-FCVR
Detailed report for:FovDotsUPIQDeepFoveaLIVE-FBT-FCVR
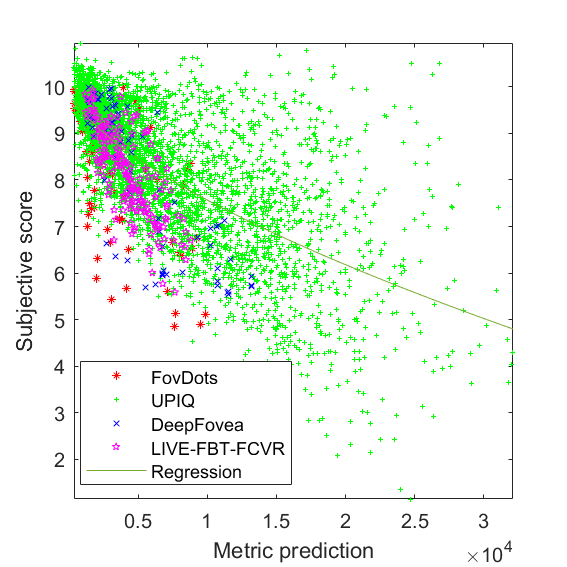 JOD regression: Q = 10 -0.00600938 * M^0.651775
Detailed report for:FovDotsUPIQDeepFoveaLIVE-FBT-FCVR
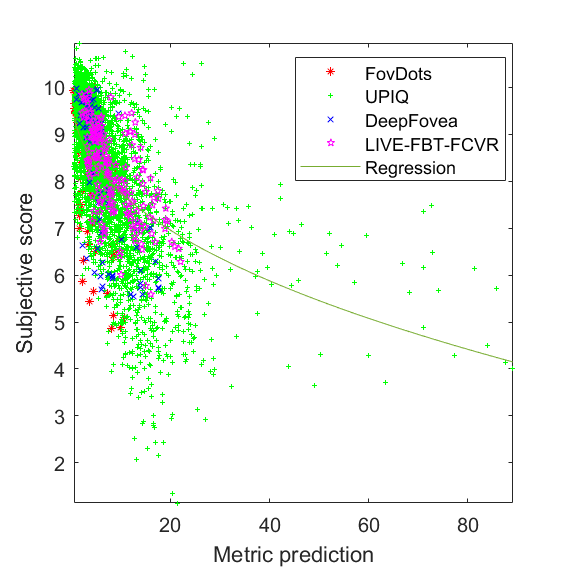 JOD regression: Q = 10 -0.821919 * M^0.437133