Local G-pyr(l+1)
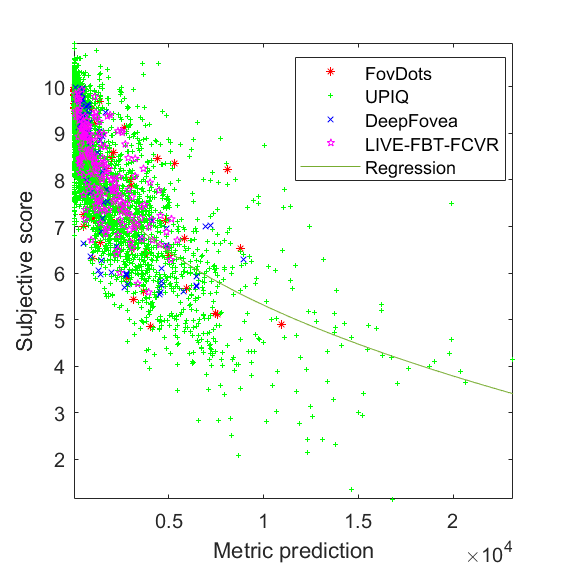
RMSE = 0.8211 PLCC = 0.8448 SROCC = 0.8173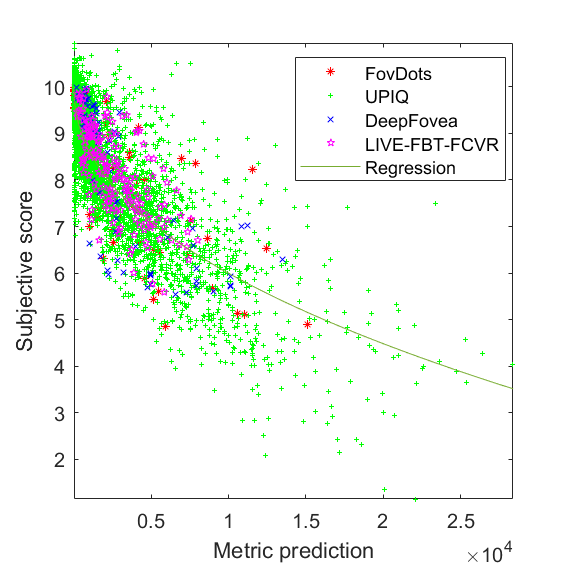 JOD regression: Q = 10 -0.0568075 * M^0.462044
| Metric/Variant | RMSE | PLCC | SROCC | ||||||||||||
| FovDots | UPIQ | DeepFovea | LIVE-FBT-FCVR | Average(1) | FovDots | UPIQ | DeepFovea | LIVE-FBT-FCVR | Average(2) | FovDots | UPIQ | DeepFovea | LIVE-FBT-FCVR | Average(3) | |
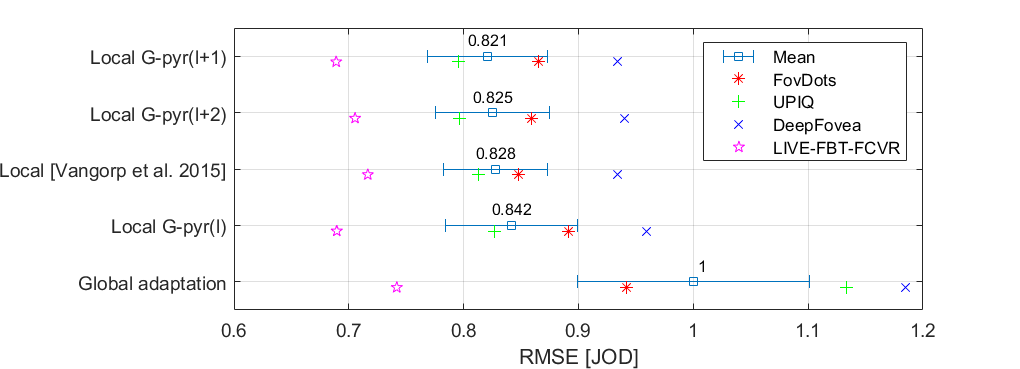
| Local G-pyr(l+1) → | 0.8655 | 0.7957 | 0.9342 | 0.689 | 0.8211 | 0.8037 | 0.849 | 0.8233 | 0.7129 | 0.8448 | 0.8312 | 0.818 | 0.8387 | 0.713 | 0.8173 |
| Local G-pyr(l+2) → | 0.8593 | 0.7963 | 0.9398 | 0.7054 | 0.8252 | 0.8071 | 0.8487 | 0.8192 | 0.7059 | 0.8443 | 0.8393 | 0.8179 | 0.8345 | 0.7043 | 0.8171 |
| Local [Vangorp et al. 2015] → | 0.8481 | 0.8127 | 0.9338 | 0.7165 | 0.8278 | 0.8121 | 0.8419 | 0.8201 | 0.7069 | 0.8378 | 0.8418 | 0.8126 | 0.8328 | 0.7039 | 0.8121 |
| Local G-pyr(l) → | 0.8911 | 0.8273 | 0.9589 | 0.6895 | 0.8417 | 0.794 | 0.8355 | 0.8193 | 0.7237 | 0.8315 | 0.8172 | 0.8068 | 0.8347 | 0.7217 | 0.8061 |
| Global adaptation → | 0.9416 | 1.134 | 1.185 | 0.7417 | 1 | 0.8061 | 0.6586 | 0.7013 | 0.6182 | 0.6596 | 0.8396 | 0.6581 | 0.6727 | 0.6273 | 0.66 |
(1)Average RMSE is computed as an average of RMSEs of individual datasets so that each dataset has the same influence on the average RMSE regardless of the number of conditions it contains.
(2-3)Average correlation coeffcients are computed for the consolidated dataset consisting of all four individual datasets. It means that the average correlation coefficients are dominated by the performance of UPIQ, which contains over 4000 conditions. For that reason, RMSE is more indicative of metric performance.
JOD regression: Q = 10 -0.0568075 * M^0.462044
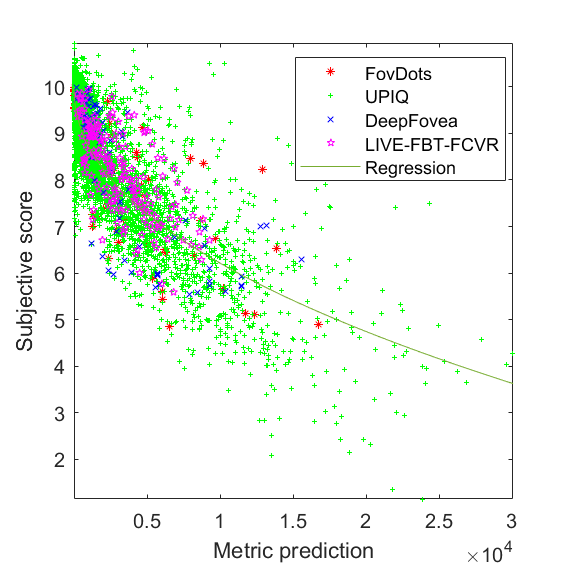 JOD regression: Q = 10 -0.048486 * M^0.47319
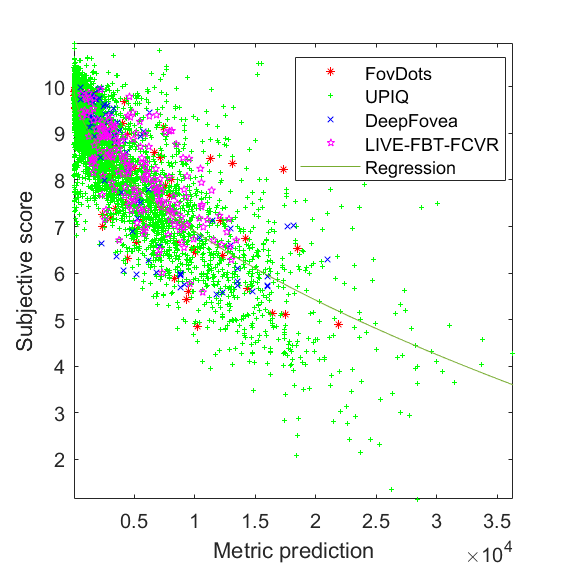 JOD regression: Q = 10 -0.0177824 * M^0.560615
 JOD regression: Q = 10 -0.111689 * M^0.405759
 JOD regression: Q = 10 -3.48351e-07 * M^1.48402