


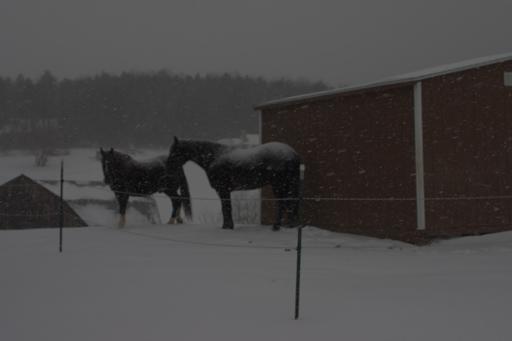
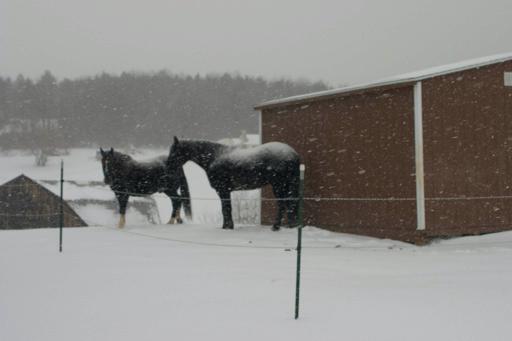
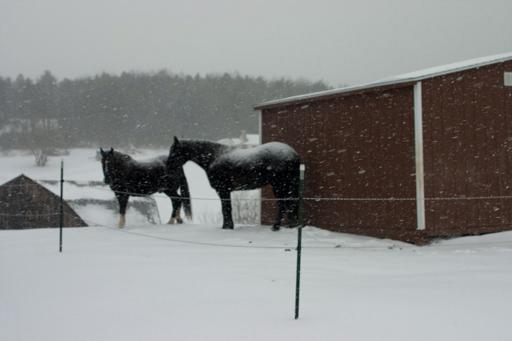


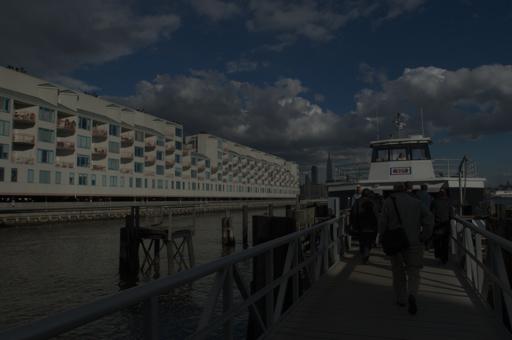
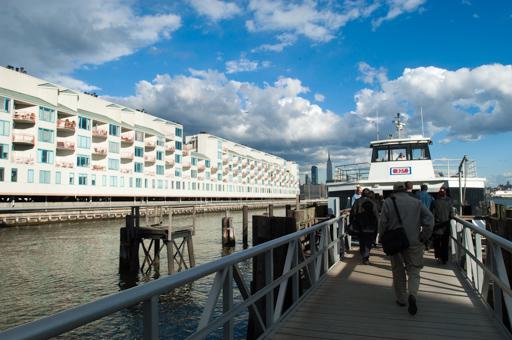
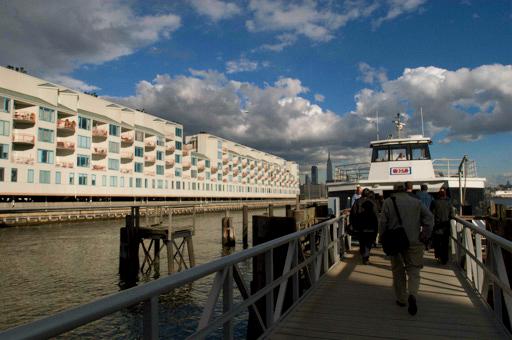

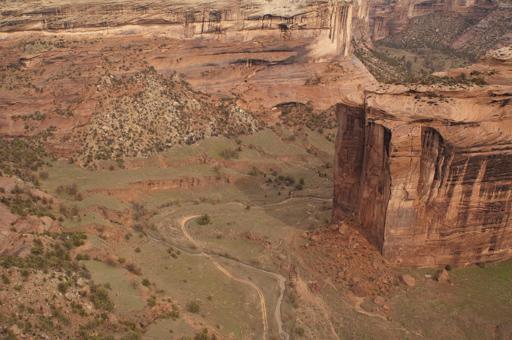
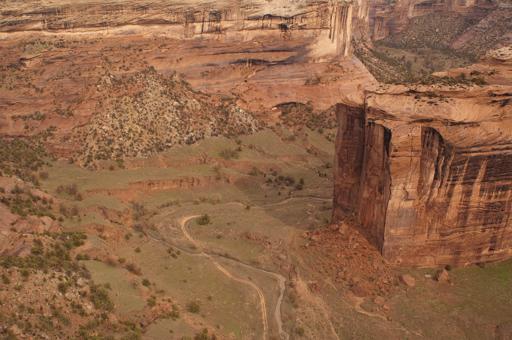


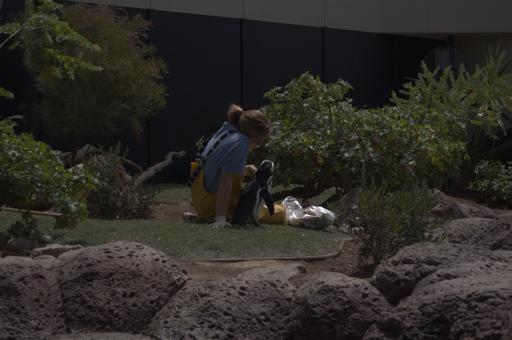


First column shows the input images.
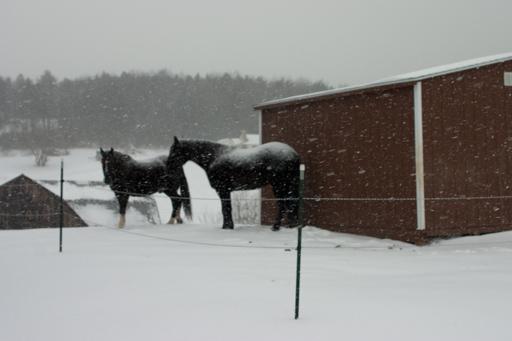
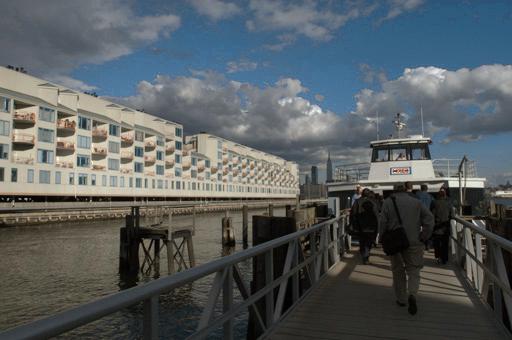
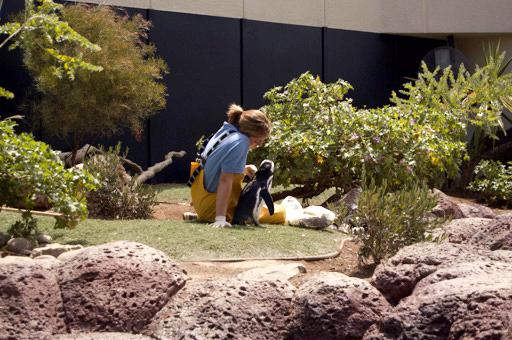
Second column shows the retouched images by Expert B.
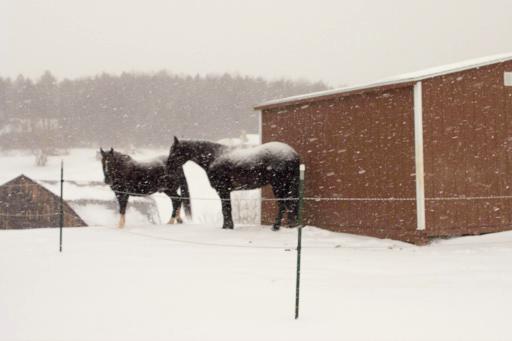
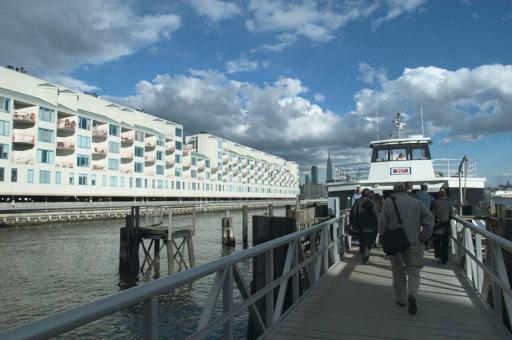
Third column shows the predicted results for HDRNet.
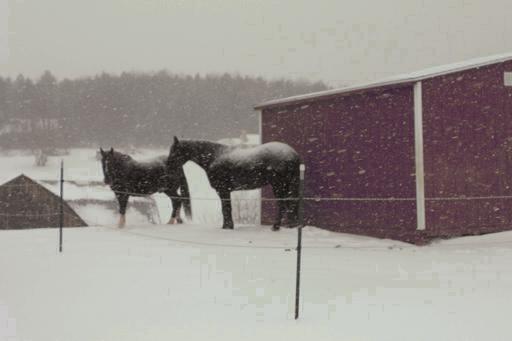
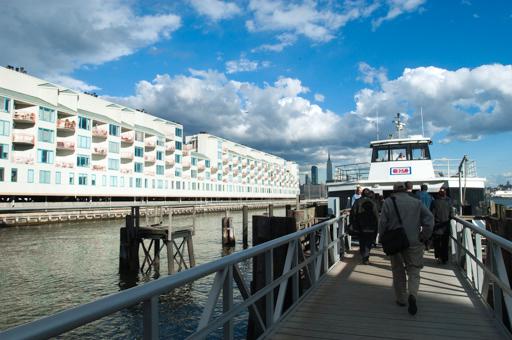
Fourth and fifth column shows the results for 3 dimensions using PCA and VAE respectively.
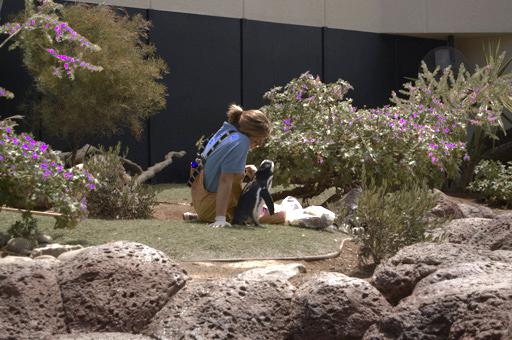
Finally we show the results using our method in the last column.
You can toggle between the predicted and the target image by clicking on the images. Moreover, you can rearrange the images in increasing or decreasing order of the metrics.
| ID | Input | Expert B | HDRNet | PSNR 23.312 | FLIP 0.308 | Delta E 2000 8.817 | PCA | PSNR 19.745 | FLIP 0.363 | Delta E 2000 10.260 | VAE | PSNR 30.786 | FLIP 0.140 | Delta E 2000 3.478 | Ours | PSNR 38.566 | FLIP 0.099 | Delta E 2000 2.004 |
|---|---|---|---|---|---|---|---|---|---|---|---|---|---|---|---|---|---|---|
| 000001 | |
|
|
30.415 | 0.156 | 3.716 | |
23.755 | 0.268 | 6.655 | |
29.643 | 0.163 | 3.772 | |
42.732 | 0.063 | 1.522 |
| 000002 | |
|
|
24.128 | 0.272 | 8.827 | |
21.814 | 0.368 | 11.028 | |
30.507 | 0.164 | 4.515 | |
35.397 | 0.097 | 3.618 |
| 000003 | |
|
|
19.217 | 0.328 | 7.597 | |
12.549 | 0.483 | 13.491 | |
23.823 | 0.225 | 8.498 | |
33.740 | 0.126 | 2.783 |
| 000004 | |
|
|
27.189 | 0.202 | 4.783 | |
20.574 | 0.316 | 7.950 | |
33.593 | 0.112 | 3.395 | |
39.741 | 0.075 | 1.566 |
| 000005 | |
|
|
15.447 | 0.509 | 12.434 | |
24.089 | 0.243 | 6.221 | |
27.339 | 0.186 | 3.555 | |
39.490 | 0.087 | 1.397 |
| 000006 | |
|
|
19.736 | 0.428 | 10.046 | |
18.504 | 0.467 | 10.489 | |
25.835 | 0.224 | 4.826 | |
32.963 | 0.166 | 2.259 |
| 000007 | |
|
|
17.267 | 0.456 | 12.638 | |
15.695 | 0.482 | 13.868 | |
23.313 | 0.262 | 6.321 | |
31.527 | 0.161 | 3.034 |
| 000008 | |
|
|
19.496 | 0.397 | 17.474 | |
22.539 | 0.300 | 10.455 | |
34.260 | 0.102 | 2.031 | |
34.230 | 0.124 | 2.340 |
| 000009 | |
|
|
19.612 | 0.382 | 8.576 | |
26.544 | 0.236 | 5.919 | |
31.253 | 0.155 | 2.747 | |
46.865 | 0.054 | 1.176 |
| 000010 | |
|
|
25.906 | 0.267 | 5.526 | |
18.908 | 0.411 | 9.424 | |
24.178 | 0.281 | 6.436 | |
38.184 | 0.120 | 1.786 |