Base model
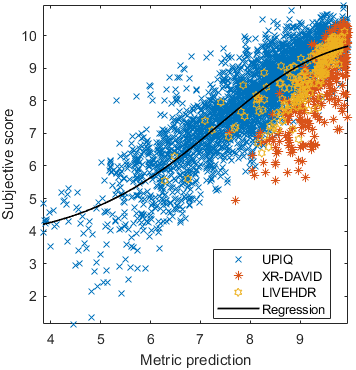
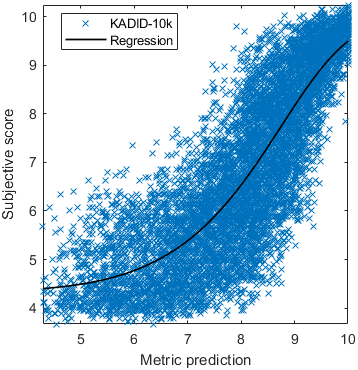
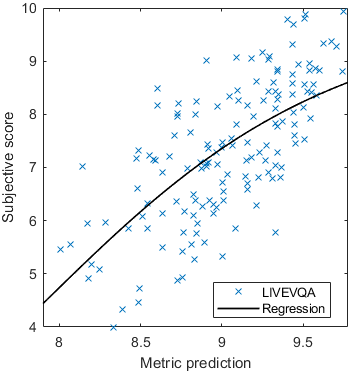
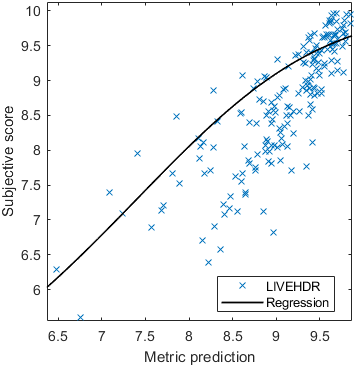
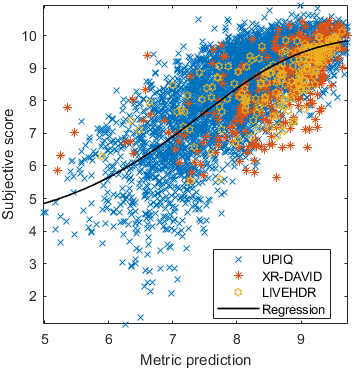
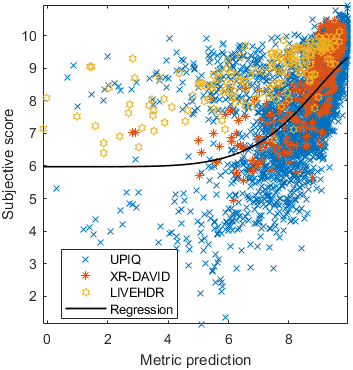
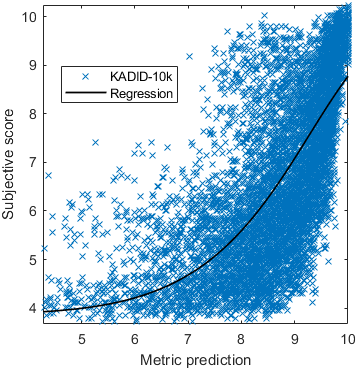
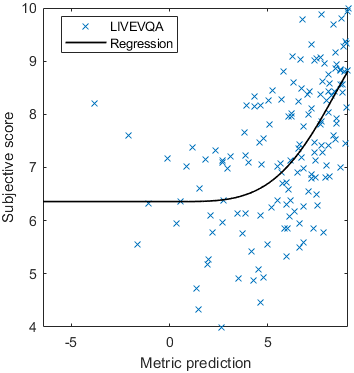
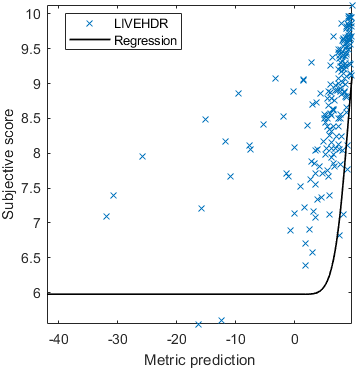
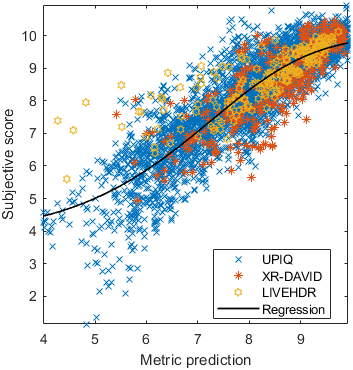
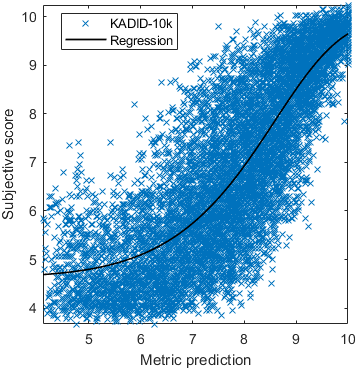
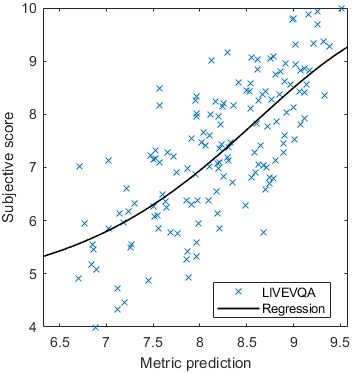
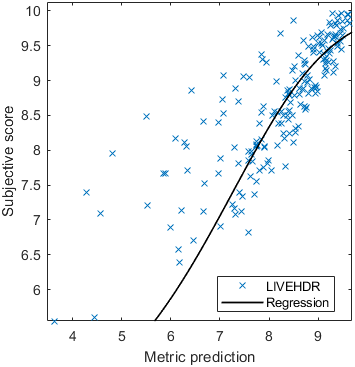
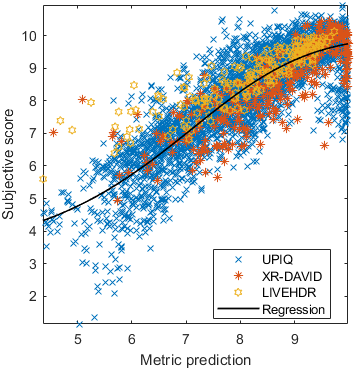
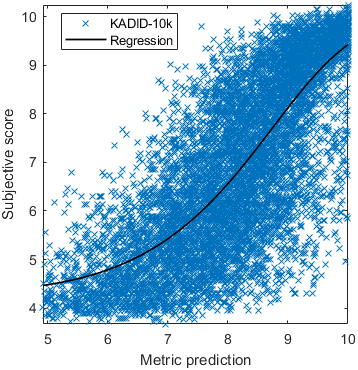
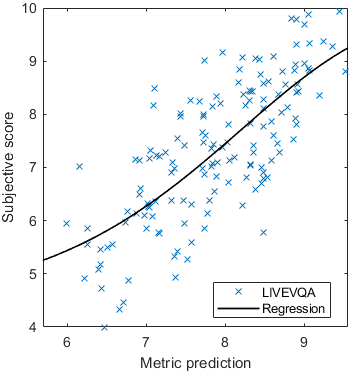
Test: RMSE = 0.6607 PLCC = 0.8773 SROCC = 0.8694Detailed report for:UPIQXR-DAVIDKADID-10kLIVEVQALIVEHDR
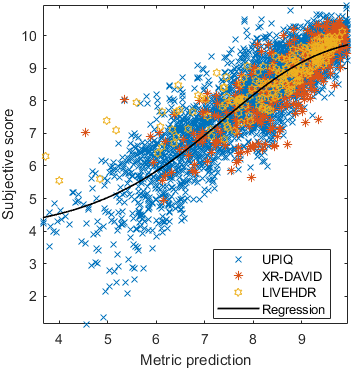
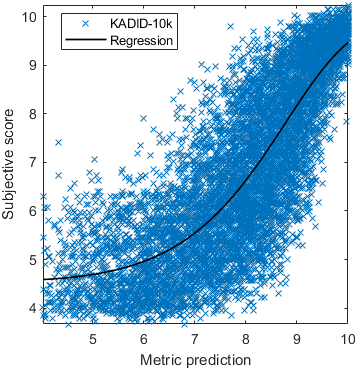
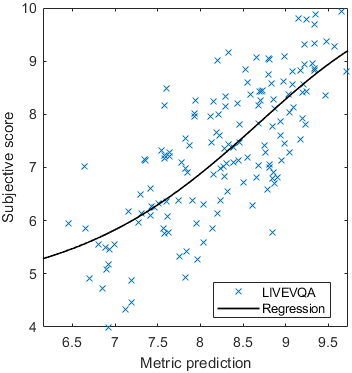
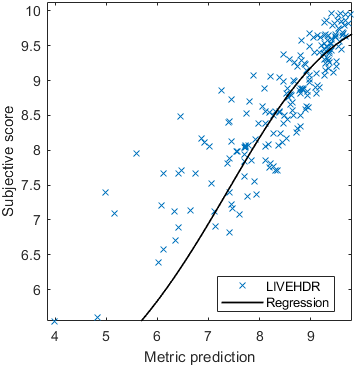
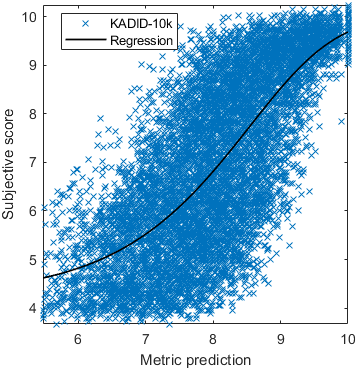
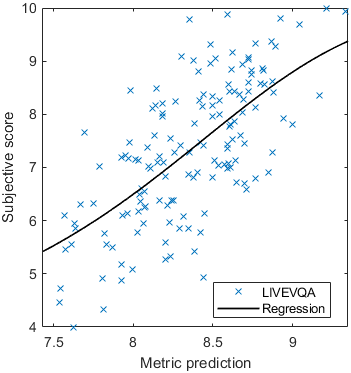
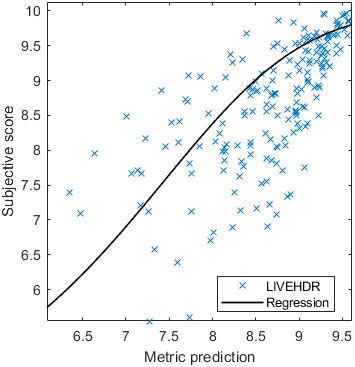
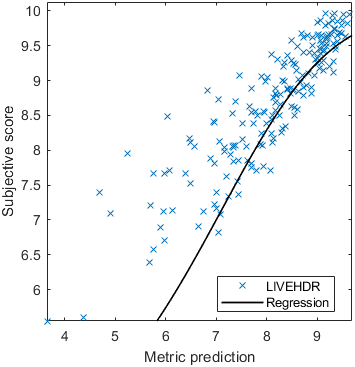
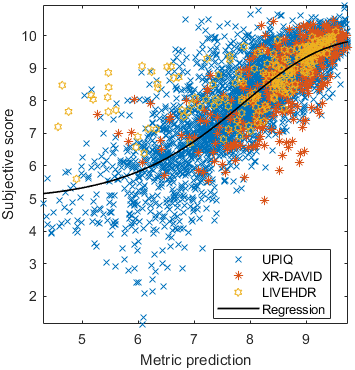
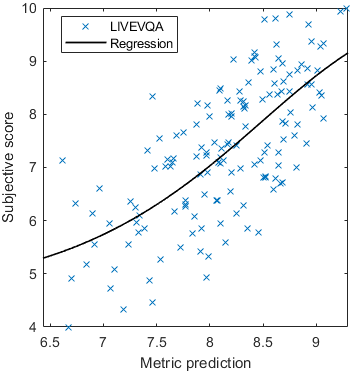
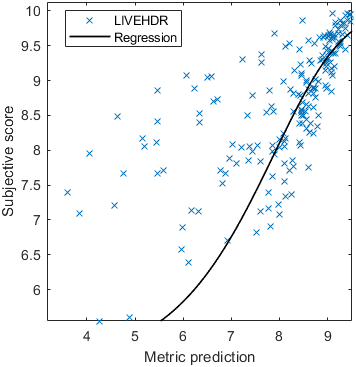
The results in the plot below are reported for the testing data only. Only UPIQ and XR-DAVID were used for training (unless stated otherwise). The training set was also used to fit the JOD regression. The detailed reports (if present) show the entire dataset (both training and testing parts).
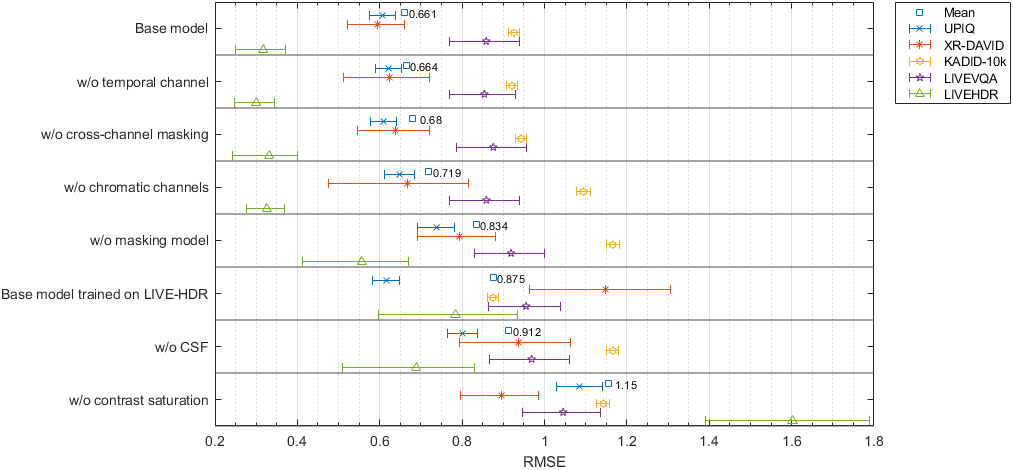
Table shows the results for test data
| Metric/Variant | RMSE | PLCC | SROCC | |||||||||||||||
|---|---|---|---|---|---|---|---|---|---|---|---|---|---|---|---|---|---|---|
| UPIQ | XR-DAVID | KADID-10k | LIVEVQA | LIVEHDR | Average(1) | UPIQ | XR-DAVID | KADID-10k | LIVEVQA | LIVEHDR | Average(2) | UPIQ | XR-DAVID | KADID-10k | LIVEVQA | LIVEHDR | Average(3) | |
| Base model → | 0.6073 | 0.5944 | 0.9262 | 0.8585 | 0.3169 | 0.6607 | 0.9 | 0.8782 | 0.8595 | 0.756 | 0.9357 | 0.8773 | 0.8759 | 0.8913 | 0.8605 | 0.7412 | 0.9244 | 0.8694 |
| w/o temporal channel → | 0.6211 | 0.6245 | 0.9212 | 0.8542 | 0.3 | 0.6642 | 0.8953 | 0.8664 | 0.8611 | 0.7589 | 0.9302 | 0.8725 | 0.8662 | 0.828 | 0.8643 | 0.7396 | 0.9163 | 0.8524 |
| w/o cross-channel masking → | 0.6099 | 0.6389 | 0.9431 | 0.8755 | 0.3314 | 0.6797 | 0.8994 | 0.8584 | 0.8536 | 0.7446 | 0.9357 | 0.8711 | 0.8758 | 0.8612 | 0.8532 | 0.7353 | 0.9194 | 0.859 |
| w/o chromatic channels → | 0.6482 | 0.6669 | 1.095 | 0.8588 | 0.3262 | 0.7189 | 0.8857 | 0.8481 | 0.7964 | 0.7558 | 0.9295 | 0.8554 | 0.8323 | 0.8065 | 0.7986 | 0.7396 | 0.9068 | 0.8253 |
| w/o masking model → | 0.738 | 0.7926 | 1.166 | 0.919 | 0.5565 | 0.8343 | 0.8473 | 0.7691 | 0.7651 | 0.7135 | 0.7706 | 0.777 | 0.8242 | 0.7513 | 0.7672 | 0.6992 | 0.8195 | 0.7763 |
| Base model trained on LIVE-HDR → | 0.6163 | 1.147 | 0.875 | 0.9553 | 0.7832 | 0.8754 | 0.8946 | 0.8612 | 0.8756 | 0.6856 | 0.8262 | 0.8406 | 0.8754 | 0.8271 | 0.8766 | 0.7058 | 0.8424 | 0.8339 |
| w/o CSF → | 0.8016 | 0.9376 | 1.166 | 0.9688 | 0.6884 | 0.9125 | 0.8129 | 0.7733 | 0.7649 | 0.6741 | 0.8472 | 0.7807 | 0.7817 | 0.8059 | 0.7624 | 0.6558 | 0.8789 | 0.7874 |
| w/o contrast saturation → | 1.086 | 0.896 | 1.143 | 1.045 | 1.602 | 1.154 | 0.6237 | 0.8127 | 0.7766 | 0.604 | 0.5745 | 0.6917 | 0.7032 | 0.8006 | 0.8167 | 0.5919 | 0.6231 | 0.7193 |
Table shows the results for all data
| Metric/Variant | RMSE | PLCC | SROCC | |||||||||||||||
|---|---|---|---|---|---|---|---|---|---|---|---|---|---|---|---|---|---|---|
| UPIQ | XR-DAVID | KADID-10k | LIVEVQA | LIVEHDR | Average(1) | UPIQ | XR-DAVID | KADID-10k | LIVEVQA | LIVEHDR | Average(2) | UPIQ | XR-DAVID | KADID-10k | LIVEVQA | LIVEHDR | Average(3) | |
| Base model → | 0.67 | 0.7768 | 0.9262 | 0.8585 | 0.6022 | 0.7667 | 0.8956 | 0.7843 | 0.8595 | 0.756 | 0.8639 | 0.8392 | 0.8876 | 0.8328 | 0.8605 | 0.7412 | 0.9071 | 0.8548 |
| w/o temporal channel → | 0.672 | 0.7803 | 0.9212 | 0.8542 | 0.7 | 0.7855 | 0.8949 | 0.7863 | 0.8611 | 0.7589 | 0.853 | 0.8376 | 0.8837 | 0.8015 | 0.8643 | 0.7396 | 0.8926 | 0.8449 |
| w/o cross-channel masking → | 0.6752 | 0.7994 | 0.9431 | 0.8755 | 0.7809 | 0.8148 | 0.894 | 0.7703 | 0.8536 | 0.7446 | 0.8069 | 0.8217 | 0.8839 | 0.8239 | 0.8532 | 0.7353 | 0.8668 | 0.8391 |
| w/o chromatic channels → | 0.713 | 0.76 | 1.095 | 0.8588 | 0.7894 | 0.8432 | 0.8809 | 0.8058 | 0.7964 | 0.7558 | 0.8796 | 0.8302 | 0.8436 | 0.8257 | 0.7986 | 0.7396 | 0.9078 | 0.8316 |
| w/o masking model → | 0.8256 | 0.9433 | 1.166 | 0.919 | 1.046 | 0.9799 | 0.8364 | 0.6659 | 0.7651 | 0.7135 | 0.6993 | 0.7426 | 0.8298 | 0.713 | 0.7672 | 0.6992 | 0.7915 | 0.7645 |
| Base model trained on LIVE-HDR → | 0.6663 | 1.245 | 0.875 | 0.9553 | 0.6961 | 0.8875 | 0.8981 | 0.7642 | 0.8756 | 0.6856 | 0.793 | 0.8174 | 0.8919 | 0.786 | 0.8766 | 0.7058 | 0.8702 | 0.8376 |
| w/o CSF → | 0.9629 | 1.078 | 1.166 | 0.9688 | 0.8232 | 0.9998 | 0.7696 | 0.6188 | 0.7649 | 0.6741 | 0.6412 | 0.6992 | 0.767 | 0.711 | 0.7624 | 0.6558 | 0.7523 | 0.7322 |
| w/o contrast saturation → | 1.1 | 0.8396 | 1.143 | 1.045 | 1.762 | 1.178 | 0.6844 | 0.7909 | 0.7766 | 0.604 | 0.7017 | 0.7181 | 0.7537 | 0.7969 | 0.8167 | 0.5919 | 0.7565 | 0.7519 |
(1)Average RMSE is computed as an average of RMSEs of individual datasets so that each dataset has the same influence on the average RMSE regardless of the number of conditions it contains.
(2-3)Average correlation coeffcients are computed by averaging individual correlation coefficients (in the Fisher's transorm space).
Detailed report for:UPIQXR-DAVIDKADID-10kLIVEVQALIVEHDR
Detailed report for:UPIQXR-DAVIDKADID-10kLIVEVQALIVEHDR
Detailed report for:UPIQXR-DAVIDKADID-10kLIVEVQALIVEHDR
Detailed report for:UPIQXR-DAVIDKADID-10kLIVEVQALIVEHDR
Detailed report for:UPIQXR-DAVIDKADID-10kLIVEVQALIVEHDR

Detailed report for:UPIQXR-DAVIDKADID-10kLIVEVQALIVEHDR