ATT Labs

An archive of

AT&T Laboratories
Cambridge

hosted in
conjunction
with

Cambridge University Computer Laboratory

The Digital Technology Group

Home Page

JCN Tool Chain

Source Level Debugging

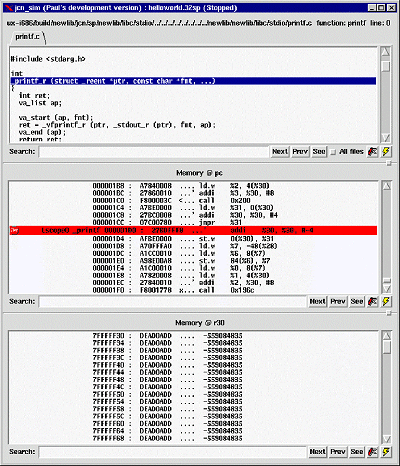
The instruction set simulator provides a convenient set of viewers to examine the state of a running application. The contents of memory can be browsed in both a raw and a disassembled view. In addition, if the code has been compiled with debug, a source-level interactive trace is also provided.

All of the windows can be configured to display either a fixed area of memory, or track the region around the address held in a register.

Breakpoints may be set and cancelled simply by clicking in these windows.

When using the in-circuit debug facility, the same interface is provided. However, the values are read directly from the hardware while the program is still running. Similarly, when a breakpoint is set or cleared, a hardware breakpoint in the JCN CPU is utilised.
Register Inspection/Controls

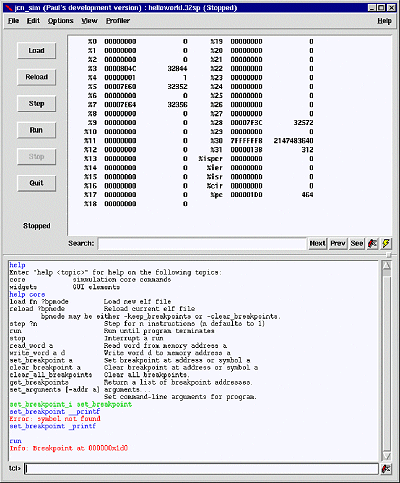
The main user interface provides both a command line interface, and a convenient set of menus. Common functions are found in a set of control buttons.

Once again, when using the in-circuit debug facility, the same user interface is presented to the user, but will reflect the values of the hardware as it runs.

Interface to External Tools

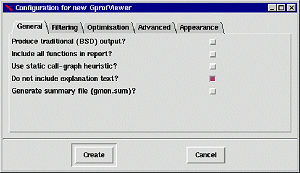
External tools, such as GPROF (providing code profiling) and GCOV (providing code coverage measurements) are interfaced to the simulator via an external call interface. All options to these external tools are set using the familiar GUI.

These pages were last modified 28/6/05.


For comments, suggestions and further information please contact us.
Copyright © 2001 AT&T Laboratories Cambridge