Histogram of the tone mapped image: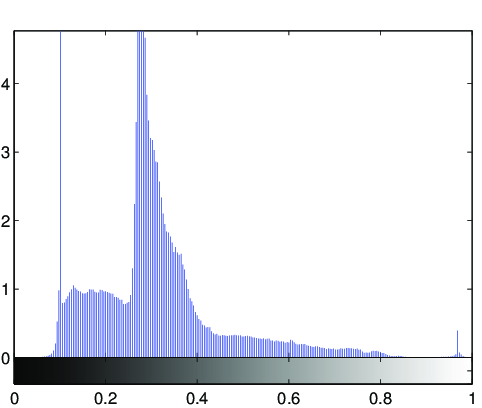
Image statistics of the tone-mapped image:Median percentile of the lightness (CIE L*a*b*): 31.3448Mean of the chroma value (CIE L*a*b*): 14.8959
(evalution of the fit via PSNR: PSNR = 34.5342dB)
Fitted tone curve of the generic tone mapping operator,
compared to the luminance compression done by the tone mapping operator: 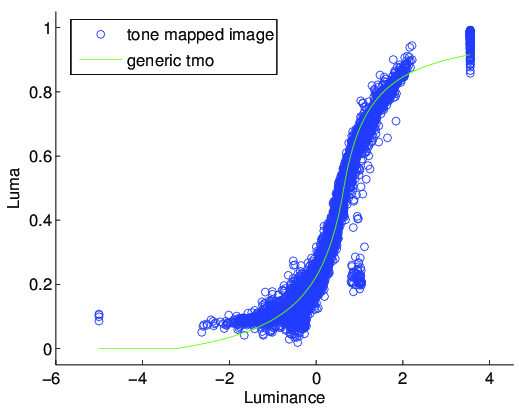
Fitted parameters of the generic tmo:Exposure: 0.64421Contrast: 1.6071Low midtone range: 3.8748High midtone range: 49.7816Saturation: 0.70328Frequencies: 0.725, 0.97, 1.022, 1.021, 1.021