Histogram of the tone mapped image: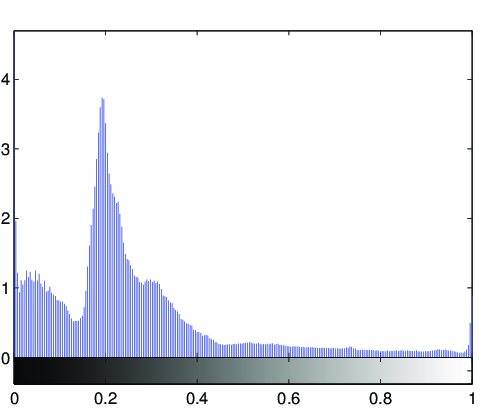
Image statistics of the tone-mapped image:Median percentile of the lightness (CIE L*a*b*): 21.6695Mean of the chroma value (CIE L*a*b*): 13.8374
(evalution of the fit via PSNR: PSNR = 29.5073dB)
Fitted tone curve of the generic tone mapping operator,
compared to the luminance compression done by the tone mapping operator: 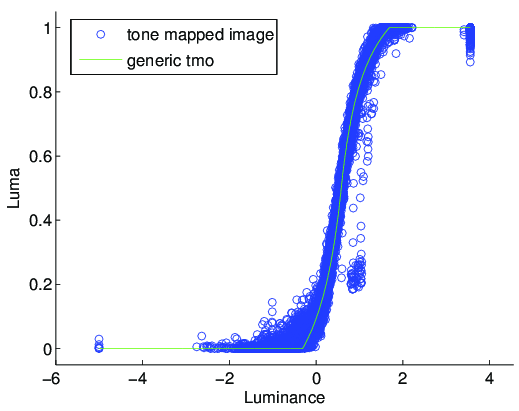
Fitted parameters of the generic tmo:Exposure: 0.58352Contrast: 2.619Low midtone range: 0.88639High midtone range: 1.1117Saturation: 0.57189Frequencies: 0.771, 0.953, 0.989, 0.99, 0.985