Histogram of the tone mapped image:
Image statistics of the tone-mapped image:Median percentile of the lightness (CIE L*a*b*): 53.308Mean of the chroma value (CIE L*a*b*): 6.2691
(evalution of the fit via PSNR: PSNR = 22.798dB)
Fitted tone curve of the generic tone mapping operator,
compared to the luminance compression done by the tone mapping operator: 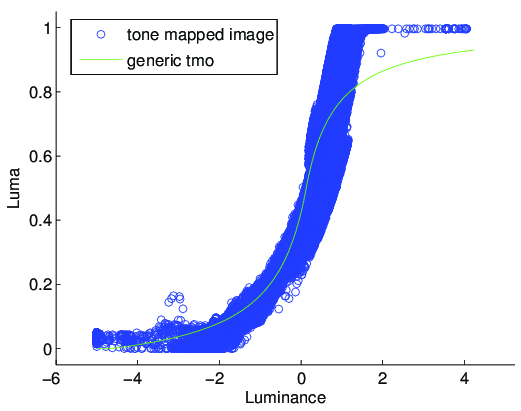
Fitted parameters of the generic tmo:Exposure: 0.13Contrast: 1.3742Low midtone range: 4.8203High midtone range: 53.2446Saturation: 0.20002Frequencies: 1.046, 0.979, 0.977, 0.976, 0.956