Histogram of the tone mapped image: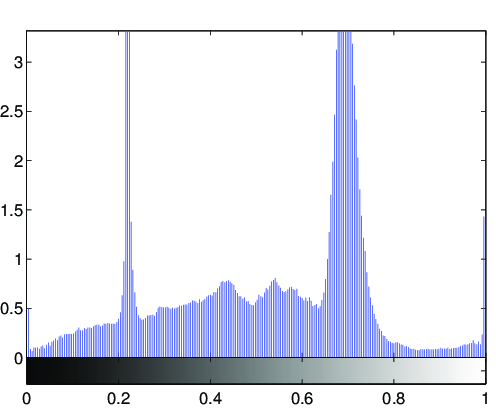
Image statistics of the tone-mapped image:Median percentile of the lightness (CIE L*a*b*): 59.503Mean of the chroma value (CIE L*a*b*): 6.6525
(evalution of the fit via PSNR: PSNR = 22.9314dB)
Fitted tone curve of the generic tone mapping operator,
compared to the luminance compression done by the tone mapping operator: 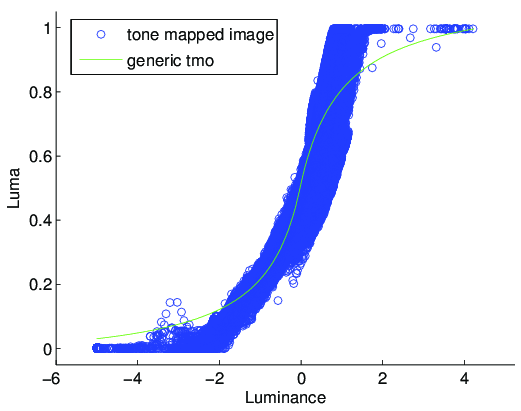
Fitted parameters of the generic tmo:Exposure: -0.021292Contrast: 1.1933Low midtone range: 8.401High midtone range: 3.8145Saturation: 0.18504Frequencies: 1.053, 1.029, 1.033, 1.022, 0.994