Histogram of the tone mapped image: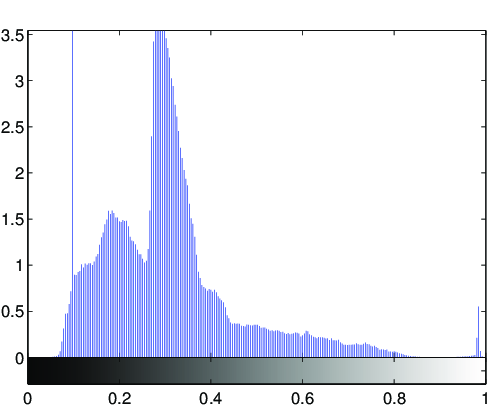
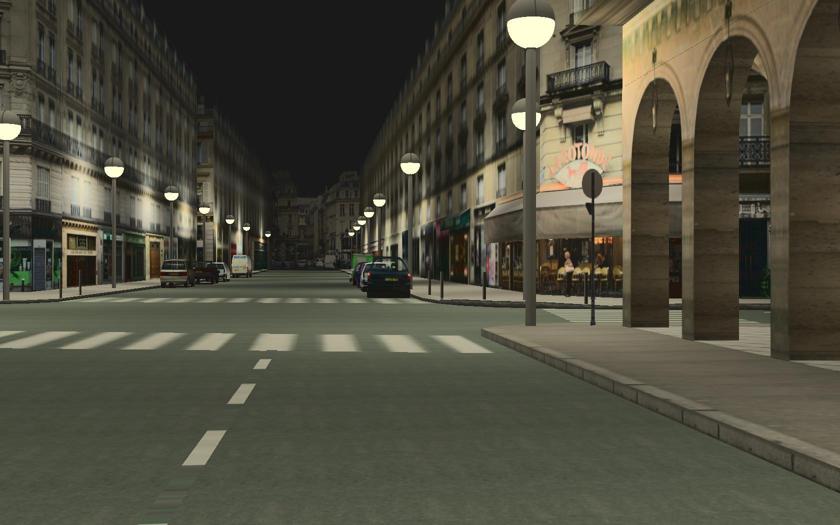
Image statistics of the tone-mapped image:Median percentile of the lightness (CIE L*a*b*): 31.6126Mean of the chroma value (CIE L*a*b*): 9.249
(evalution of the fit via PSNR: PSNR = 35.7245dB)

Fitted tone curve of the generic tone mapping operator,
compared to the luminance compression done by the tone mapping operator: 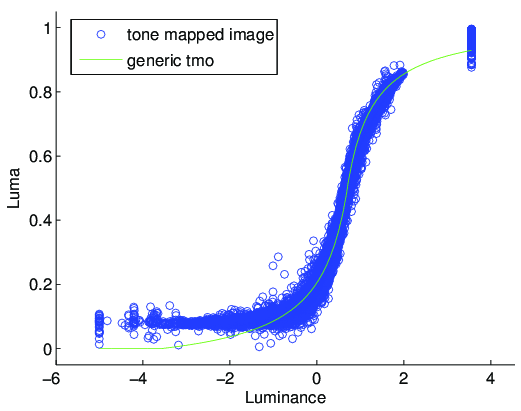
Fitted parameters of the generic tmo:Exposure: 0.70416Contrast: 1.7172Low midtone range: 4.2906High midtone range: 14.014Saturation: 0.44054Frequencies: 0.717, 0.951, 0.995, 1.001, 0.996