
Histogram of the tone mapped image: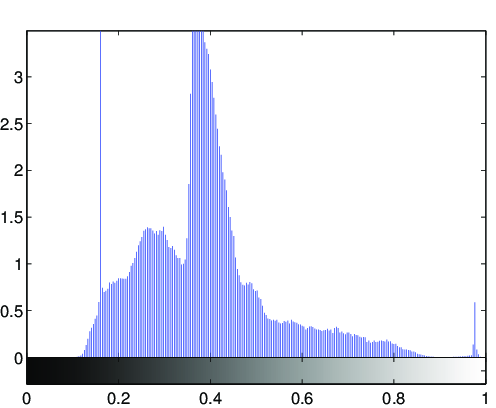
Image statistics of the tone-mapped image:Median percentile of the lightness (CIE L*a*b*): 41.0136Mean of the chroma value (CIE L*a*b*): 15.0996
(evalution of the fit via PSNR: PSNR = 36.9587dB)
Fitted tone curve of the generic tone mapping operator,
compared to the luminance compression done by the tone mapping operator: 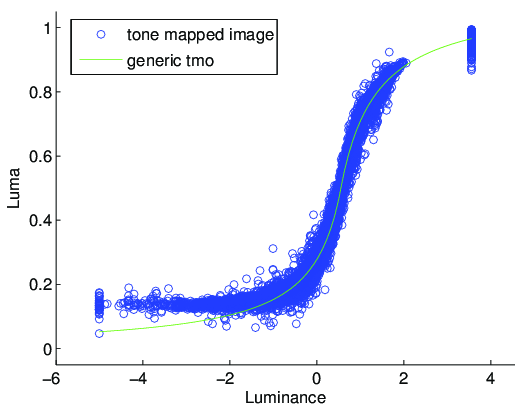
Fitted parameters of the generic tmo:Exposure: 0.55511Contrast: 1.4341Low midtone range: 80.2353High midtone range: 4.4137Saturation: 0.61169Frequencies: 0.656, 0.957, 1.006, 1.001, 1.003