Histogram of the tone mapped image: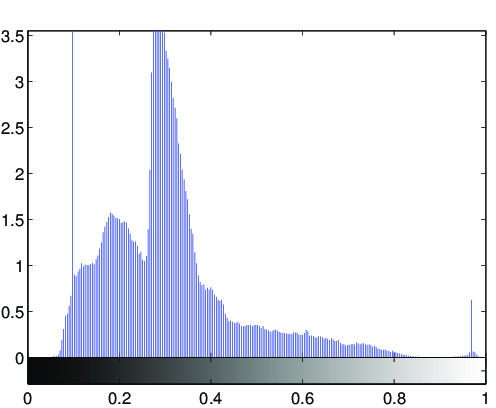
Image statistics of the tone-mapped image:Median percentile of the lightness (CIE L*a*b*): 31.7422Mean of the chroma value (CIE L*a*b*): 15.1878
(evalution of the fit via PSNR: PSNR = 35.0332dB)
Fitted tone curve of the generic tone mapping operator,
compared to the luminance compression done by the tone mapping operator: 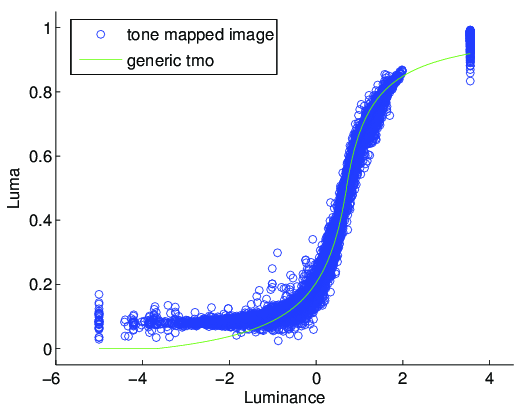
Fitted parameters of the generic tmo:Exposure: 0.70446Contrast: 1.728Low midtone range: 4.3863High midtone range: 54.0951Saturation: 0.76437Frequencies: 0.709, 0.957, 1.004, 1.003, 0.998