Histogram of the tone mapped image: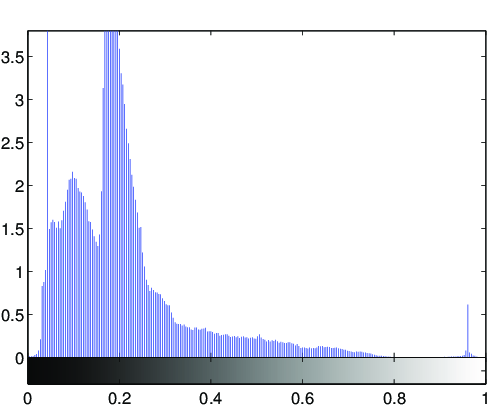
Image statistics of the tone-mapped image:Median percentile of the lightness (CIE L*a*b*): 19.5296Mean of the chroma value (CIE L*a*b*): 13.7325
(evalution of the fit via PSNR: PSNR = 32.2049dB)
Fitted tone curve of the generic tone mapping operator,
compared to the luminance compression done by the tone mapping operator: 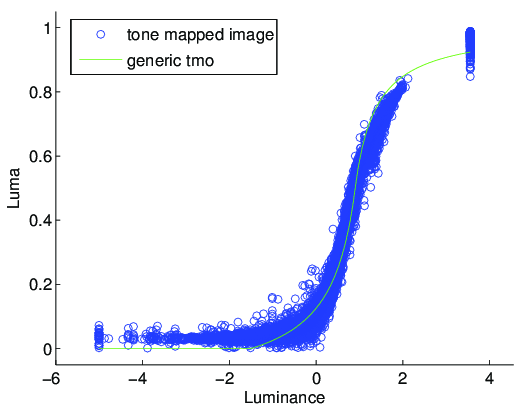
Fitted parameters of the generic tmo:Exposure: 0.90944Contrast: 2.071Low midtone range: 2.4117High midtone range: 361.4809Saturation: 1.0059Frequencies: 0.81, 0.971, 1.01, 1.016, 1.01